Folium Map Plotting
The FoliumMap
class is a wrapper around the Folium geo-mapping interactive
mapping package.
See Folium.
The MSTICPy Folium plotting can be used with DataFrames, IP addresses, locations, and geohashes as well as the MSTICPy IpAddress and GeoLocation entities.
You can use Folium via a pandas accessor, the plot_map function or directly interacting with our FoliumMap class.
Plotting from a Pandas DataFrame
MSTICPy uses pandas accessors to expose a lot of its visualization functions.
Plotting with Folium can be done directly from a pandas DataFrame using
the mp_plot.folium_map extension.
See plot_map
This function returns an instance of the
FoliumMap class that you
can further customize (see FoliumMap class later in the document)
We’ll read in some IpAddress data to use in the examples
# read in a DataFrame from a csv file
geo_loc_df = (
    pd
    .read_csv("data/ip_locs.csv", index_col=0)
    .dropna(subset=["Latitude", "Longitude"])  # We need to remove any NaN values
)
display(geo_loc_df.head(5))
CountryCode |
CountryName |
State |
City |
Longitude |
Latitude |
Asn |
IpAddress |
|---|---|---|---|---|---|---|---|
US |
United States |
Virginia |
Boydton |
-78.375 |
36.6534 |
nan |
65.55.44.109 |
CA |
Canada |
Ontario |
Toronto |
-79.4195 |
43.6644 |
nan |
13.71.172.128 |
CA |
Canada |
Ontario |
Toronto |
-79.4195 |
43.6644 |
nan |
13.71.172.130 |
US |
United States |
Texas |
San Antonio |
-98.4926 |
29.4221 |
nan |
40.124.45.19 |
US |
United States |
Iowa |
Des Moines |
-93.6127 |
41.6015 |
nan |
104.43.212.12 |
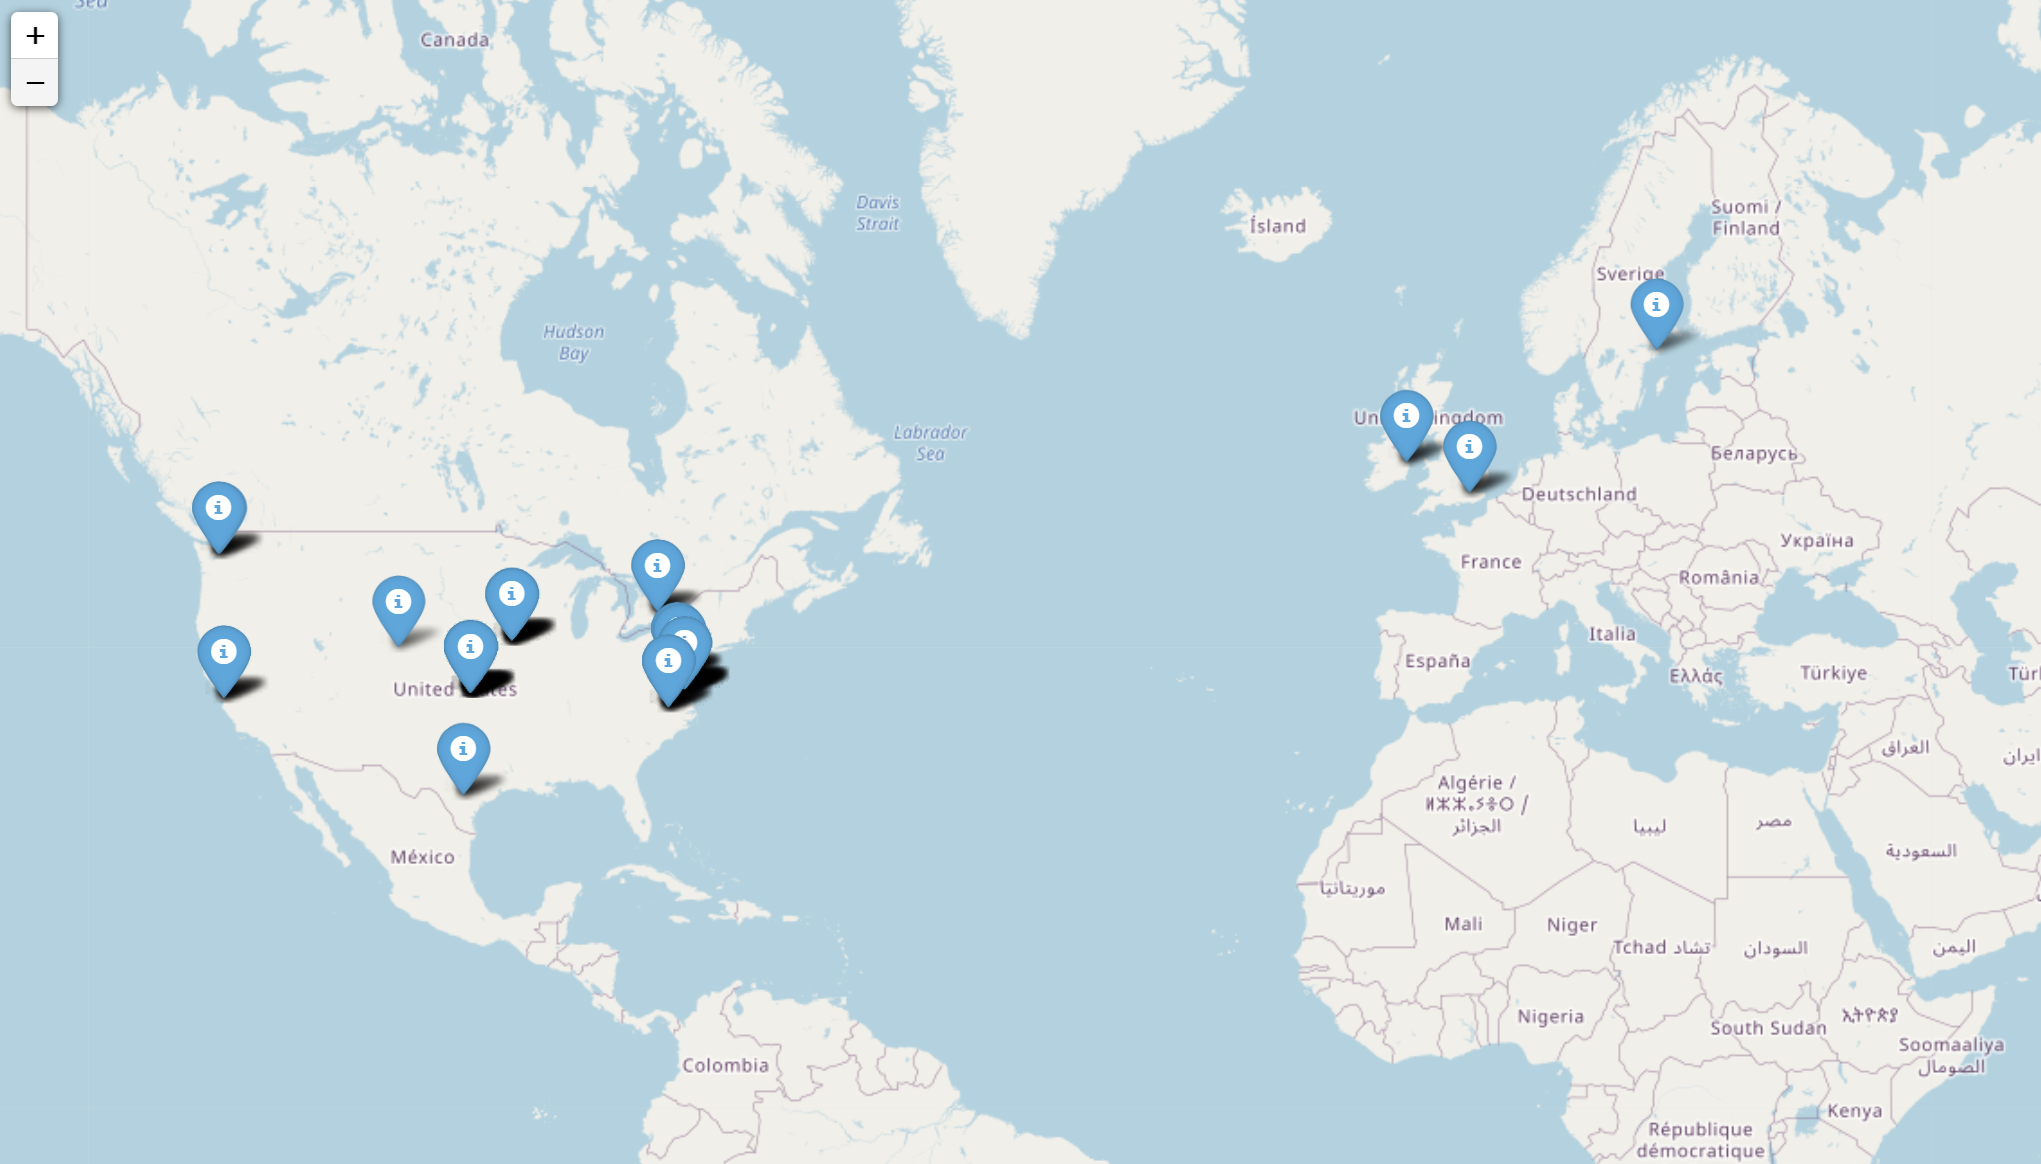
Basic plot
geo_loc_df.mp_plot.folium_map(ip_column="IPAddress")
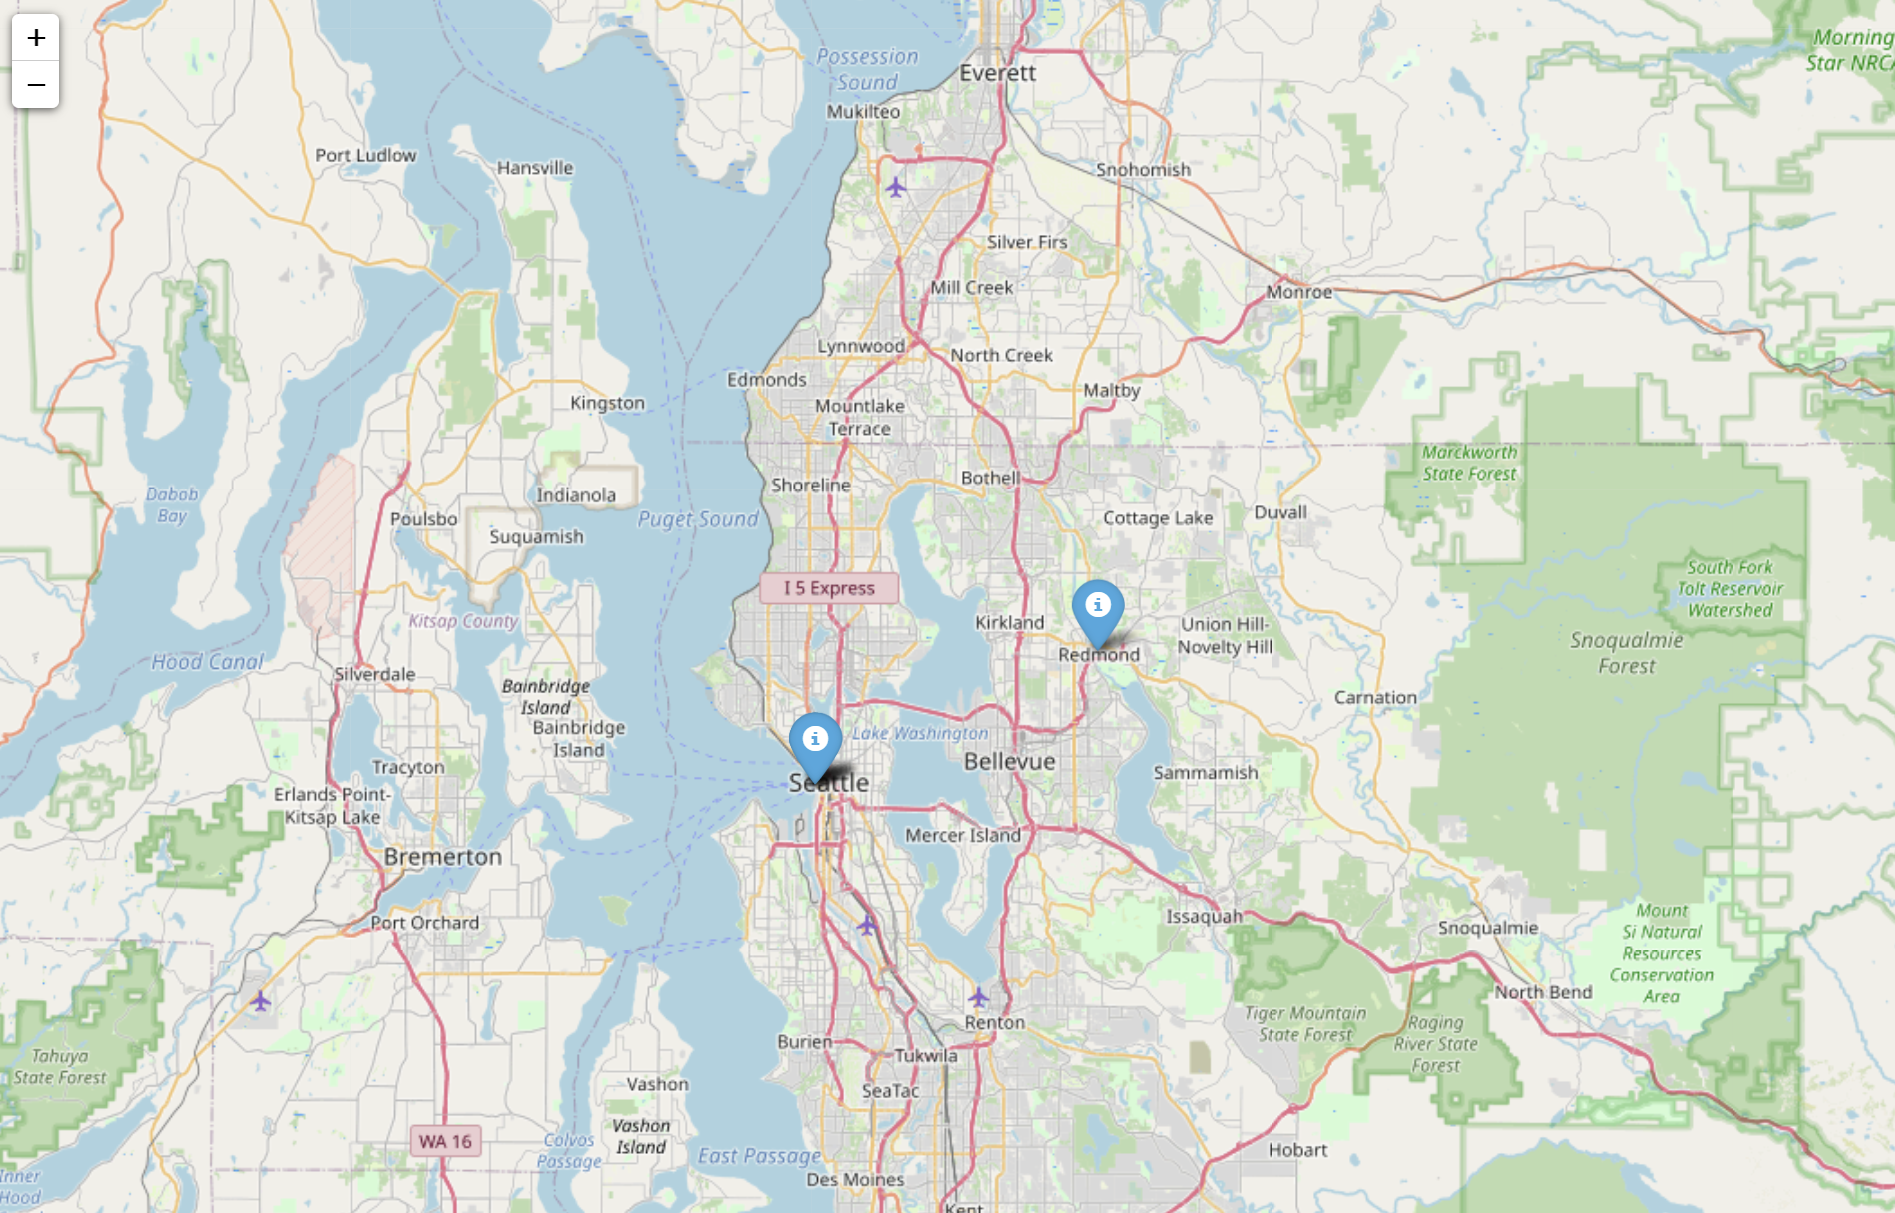
Plotting from coordinates
If you already have coordinates in the data you can use these (rather
than looking up the IP location again) using the lat_column and
long_column parameters.
geo_loc_df.mp_plot.folium_map(
    lat_column="Latitude", long_column="Longitude", zoom_start=10
)
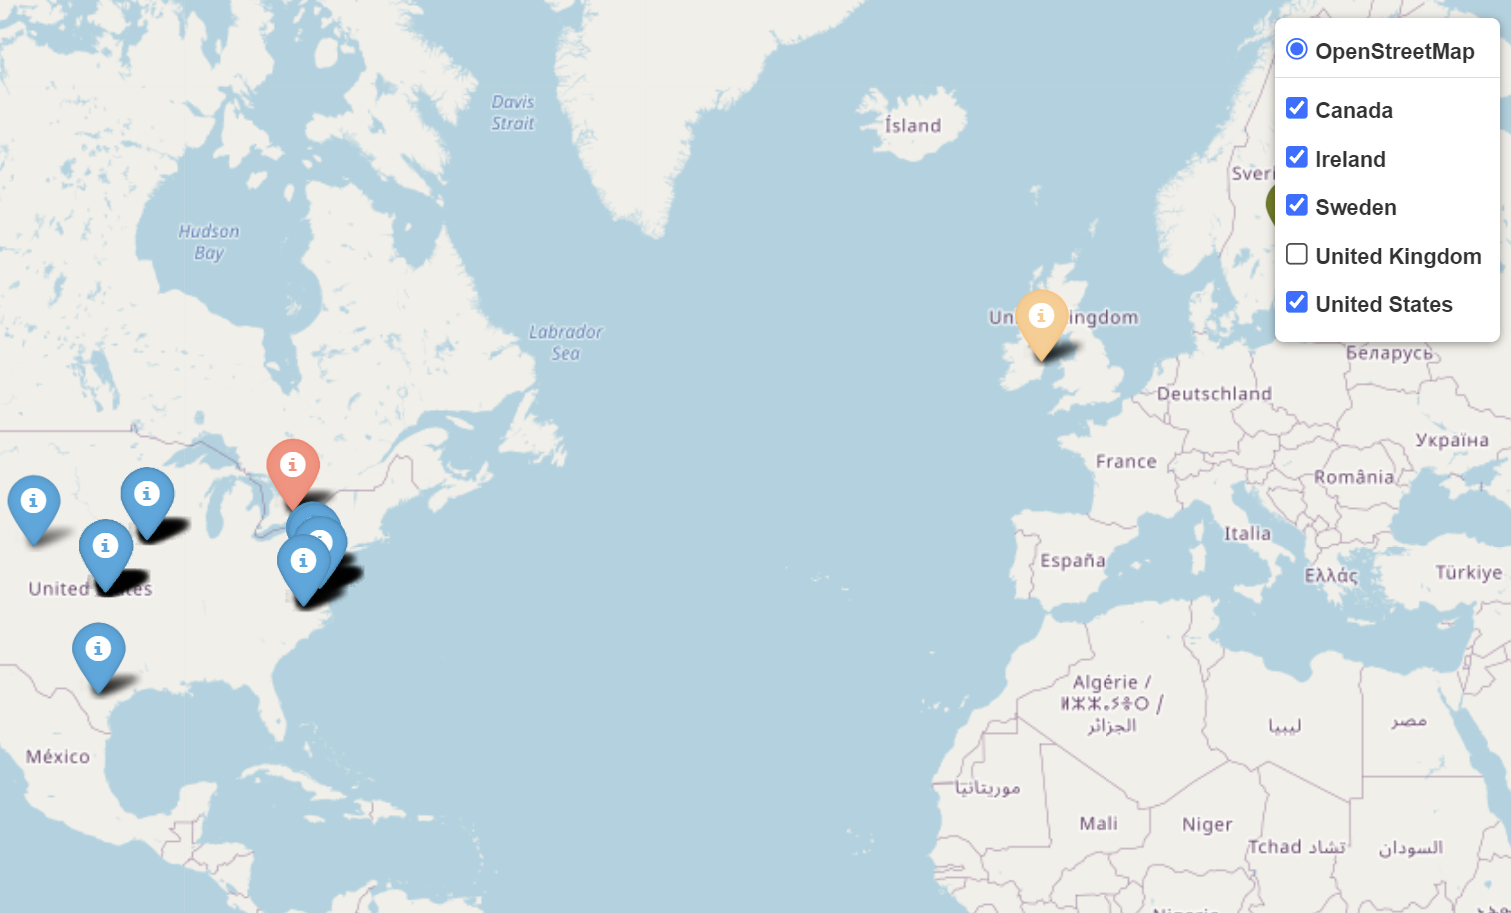
Plotting Layers
You can use the Folium layers feature, specifying a column value on
which to group each layer with the layer_column parameter.
geo_loc_df.mp_plot.folium_map(
    ip_column="IPAddress", layer_column="CountryName", zoom_start=2
)
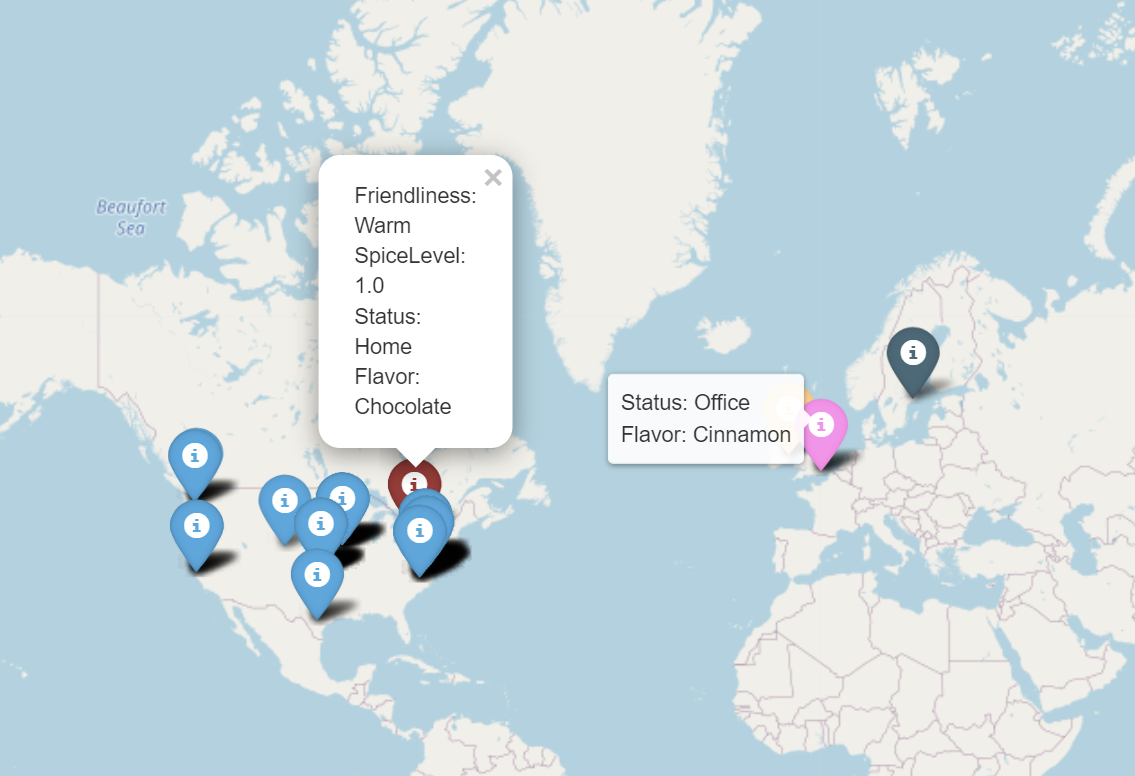
Adding custom tooltip and popup data
You use DataFrame column values to populate the tooltip and popup
elements for each marker with the tooltip_columns and
popup_columns parameters.
Although these parameters are shown being used together you can either of them separately.
First we add some random data to our DataFrame
# Create some data to display
data_df = pd.DataFrame({
    "Status": ["Home", "Office", "Vacation"] * (len(geo_loc_df) // 3),
    "Friendliness": ["Warm", "Cold", "Medium"] * (len(geo_loc_df) // 3),
    "Flavor": ["Chocolate", "Cinnamon", "Mango"] * (len(geo_loc_df) // 3),
    "SpiceLevel": [1, 2, 3] * (len(geo_loc_df) // 3)
})
geo_loc_data_df = pd.concat([geo_loc_df, data_df], axis=1)
Then plot using the tooltip_columns and
popup_columns parameters
geo_loc_data_df.mp_plot.folium_map(
    ip_column="IPAddress",
    layer_column="CountryName",
    tooltip_columns=["Status", "Flavor"],
    popup_columns=["Friendliness", "SpiceLevel", "Status", "Flavor"],
    zoom_start=2,
)
Using custom icons
You can also control the icons used for each marker with the
icon_column parameters. If you happen to have a column in your data
that contains names of FontAwesome or GlyphIcons icons. More typically
you would combine the icon_column with the icon_map parameter.
You can specify either a dictionary or a function. For a dictionary, the
value of the row in icon_column is used as a key - the value is a
dictionary of icon parameters passed to the Folium.Icon class. For a
method, the icon_column value is passed as a single parameter and
the return value should be a dictionary of valid parameters for the
Icon class. You can read the documentation for this function in the
doc.
If icon_map is a dict it should contain keys that map to the value
of icon_col. The values of te dict should be dicts of valid folium Icon properties
(“color”, “icon_color”, “icon”, “angle”, “prefix”). The dict should
include a “default” entry that will be used if the value in the
DataFrame[icon_col] doesn’t match any key. For example:
icon_map = {
    "high": {
        "color": "red",
        "icon": "warning",
    },
    "medium": {
        "color": "orange",
        "icon": "triangle-exclamation",
        "prefix": "fa",
    },
    "default": {
        "color": "blue",
        "icon": "info-sign",
    },
}
If icon_map is a function it should take a single str parameter (the
item key) and return a dict of icon properties. It should return a
default set of values if the key does not match a known key. The
icon_col value for each row will be passed to this function and the
return value used to populate the Icon arguments.
For example:
def icon_mapper(icon_key):
    if icon_key.startswith("bad"):
        return {
            "color": "red",
            "icon": "triangle-alert",
        }
    ...
    else:
        return {
            "color": "blue",
            "icon": "info-sign",
        }
Check out the possible names for icons:
FontAwesome icon (prefix “fa”) names are available at https://fontawesome.com/
GlyphIcons icons (prefix “glyphicon”) are available at https://www.glyphicons.com/
icon_map = {
    "US": {
        "color": "green",
        "icon": "flash",
    },
    "GB": {
        "color": "purple",
        "icon": "flash",
    },
    "default": {
        "color": "blue",
        "icon": "info-sign",
    },
}

geo_loc_df.mp_plot.folium_map(
    ip_column="IPAddress",
    icon_column="CountryCode",
    icon_map=icon_map,
    zoom_start=2,
)
Using the plot_map function
The plot_map function is identical to the mp_plot.folium_map
accessor. You can import this directly and use in place of the pandas
accessor.
from msticpy.vis.foliummap import plot_map

plot_map(
    data=geo_loc_df,
    ip_column="IPAddress",
    icon_column="CountryCode",
    icon_map=icon_map,
    zoom_start=2,
)
FoliumMap class
Use the FoliumMap class
when you want to build up data clusters and
layers incrementally.
It now supports multiple data types for entry:
IpAddress entities (
add_ip_cluster)Geolocation entities (
add_ip_cluster)IP addresses (
add_ip_cluster)Locations (
add_ip_cluster)GeoHashes (
add_ip_cluster)
You can also use other member functions to add layers and cluster
groups see FoliumMap class
for more details.
Here is the documentation for initializing the class.
FoliumMap(
    title: str = 'layer1',
    zoom_start: float = 2.5,
    tiles=None,
    width: str = '100%',
    height: str = '100%',
    location: list = None,
)
Wrapper class for Folium/Leaflet mapping.

Parameters
----------
title : str, optional
    Name of the layer (the default is 'layer1')
zoom_start : int, optional
    The zoom level of the map (the default is 7)
tiles : [type], optional
    Custom set of tiles or tile URL (the default is None)
width : str, optional
    Map display width (the default is '100%')
height : str, optional
    Map display height (the default is '100%')
location : list, optional
    Location to center map on

Attributes
----------
folium_map : folium.Map
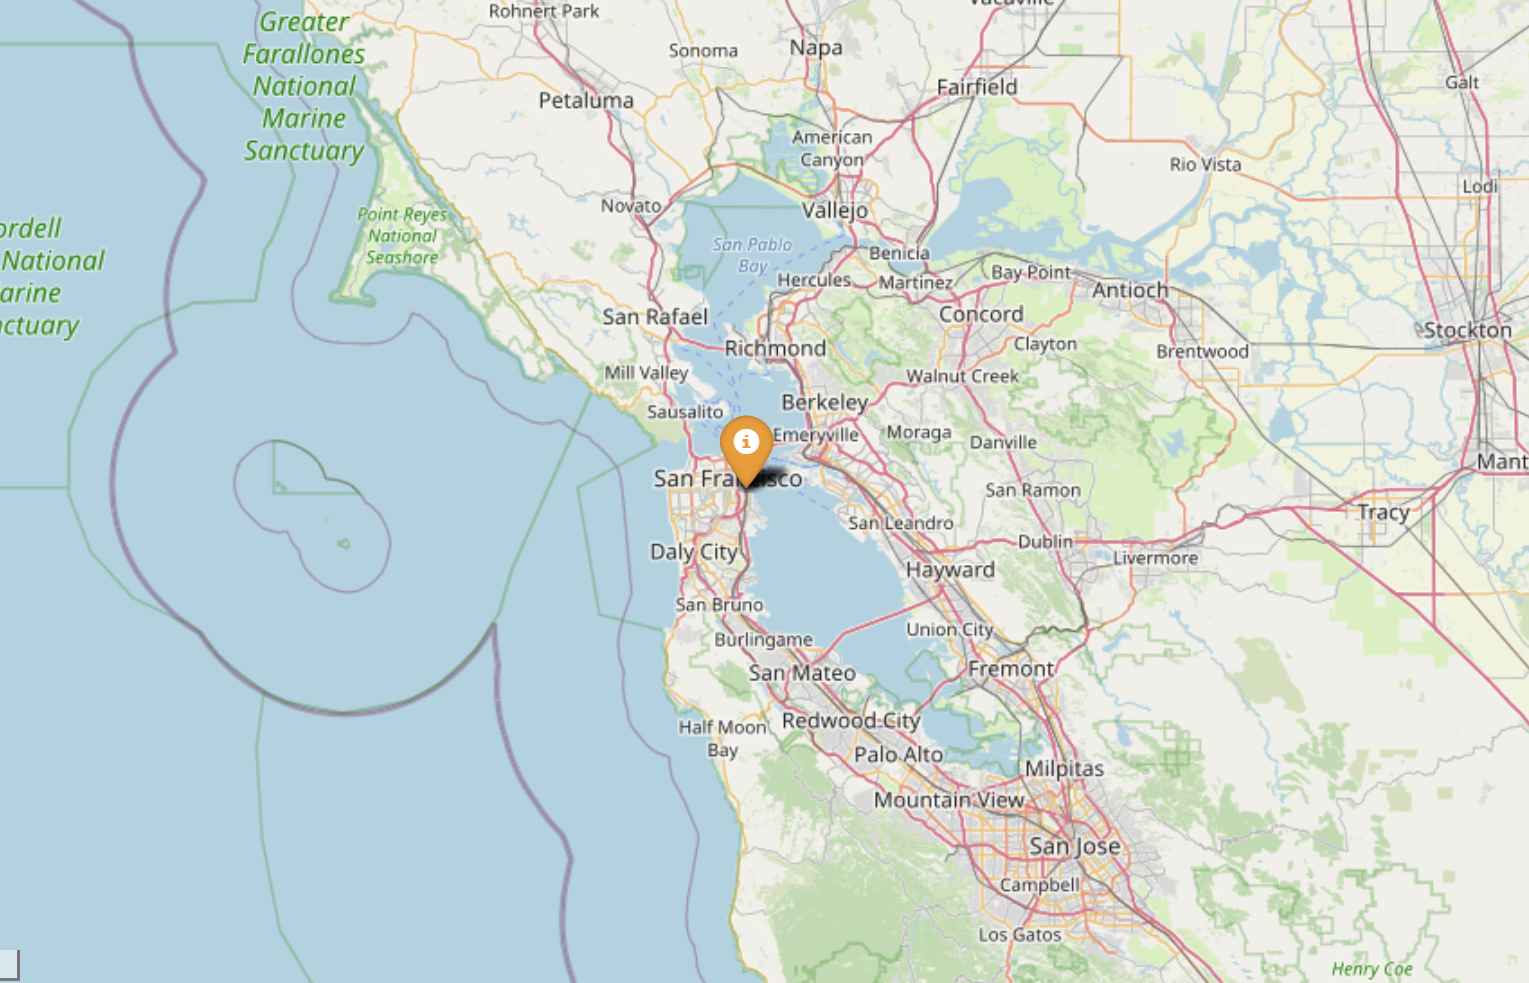
folium_map = FoliumMap(location=(47.5982328,-122.331), zoom_start=14)
folium_map
The underlying folium map object is accessible as the folium_map
attribute
type(folium_map.folium_map)
Adding IP Entities to the map
msticpy.vis.foliummap.FoliumMap
fol_map.add_ip_cluster(
    ip_entities: Iterable[msticpy.datamodel.entities.IpAddress],
    **kwargs,
)
import pickle
with open(b"data/ip_entities.pkl", "rb") as fh:
    ip_entities = pickle.load(fh)
ip_entities = [ip for ip in ip_entities if ip.Location and ip.Location.Latitude]

folium_map = FoliumMap(zoom_start=9)
folium_map.add_ip_cluster(ip_entities=ip_entities, color='orange')
folium_map.center_map()
folium_map
Adding IP addresses
Signature
ip_map.add_ips(ip_addresses: Iterable[str], **kwargs)
Example
ips = geo_loc_df.query("State == 'California'").IPAddress.values

print("IP dataset", ips[:3], "...")
ip_map = FoliumMap(zoom_start="3")
ip_map.add_ips(ips)
ip_map.center_map()
ip_map
Adding locations
Signature
ip_map.add_locations(locations: Iterable[Tuple[float, float]], **kwargs)
Example
locations = geo_loc_df.query("CountryCode != 'US'").apply(lambda x: (x.Latitude, x.Longitude), axis=1).values

print("Location dataset", locations[:3], "...")
ip_map.add_locations(locations)
ip_map.center_map()
ip_map
Plotting IPAddress entities with location data
# Create IP and GeoLocation Entities from the dataframe
def create_ip_entity(row):
    ip_ent = IpAddress(Address=row["IPAddress"])
    geo_loc = create_geo_entity(row)
    ip_ent.Location = geo_loc
    return ip_ent

def create_geo_entity(row):
    # get subset of fields for GeoLocation
    loc_props = row[["CountryCode", "CountryName","State", "City", "Longitude", "Latitude"]]
    return GeoLocation(**loc_props.to_dict())


geo_locs = list(geo_loc_df.apply(create_geo_entity, axis=1).values)
ip_ents = list(geo_loc_df.apply(create_ip_entity, axis=1).values)

fmap_ips = FoliumMap()
fmap_ips.add_ip_cluster(ip_entities=ip_ents[:20], color='blue')
fmap_ips.center_map()
fmap_ips
Using different colors and icons
fmap_ips.add_ip_cluster(ip_entities=ip_ents[30:40], color='red', icon="flash")
fmap_ips.center_map()
fmap_ips
Using custom Icons with FoliumMap class
By default folium uses the information icon (i). Icons can be taken from the default Bootstrap set. See the default list here glyphicons
Alternatively you can use icons from the Font Awesome collection by adding prefx=”fa” and icon=”icon_name” to the call to add_ip_cluster or add_geo_cluster.
fmap_ips.add_geoloc_cluster(
    geo_locations=geo_locs[40:50],
    color='darkblue',
    icon="desktop",
    prefix="fa"
)
fmap_ips.center_map()
fmap_ips
Utility Functions
Calculate center point of entity locations
from msticpy.vis.foliummap import get_map_center, get_center_ip_entities, get_center_geo_locs

print(get_center_geo_locs(geo_locs))
print(get_center_geo_locs(geo_locs, mode="mean"))

# get_map_center Will accept iterable of any entity type that is either
# an IpAddress entity or an entity that has properties of type IpAddress
print(get_map_center(ip_ents[30:40]))
print(get_map_center(ip_ents[:20]))

print(get_center_ip_entities(ip_ents[:20]))
(38.7095, -79.4195)
(40.01865529411764, -84.9259)
(38.7095, -78.1539)
(38.7095, -86.5161)
(38.7095, -86.5161)
Calculate distance between entity locations
from msticpy.context.geoip import entity_distance

print("Distance between")
print(f"{ip_ents[0].Address} ({ip_ents[0].Location.City})")
print(f"{ip_ents[1].Address} ({ip_ents[1].Location.City})")
print(entity_distance(ip_ents[0], ip_ents[1]), "km", "\n")

print("Distance between")
print(f"{ip_ents[0].Address} ({ip_ents[0].Location.City})")
print(f"{ip_ents[13].Address} ({ip_ents[13].Location.City})")
print(entity_distance(ip_ents[0], ip_ents[13]), "km", "\n")
Distance between
65.55.44.109 (Boydton)
13.71.172.128 (Toronto)
784.604908273247 km

Distance between
65.55.44.109 (Boydton)
131.107.147.209 (Redmond)
3751.614749340525 km
Converting IP Address Strings to IpAddress entities
This example uses an function to create
IpAddress entities
from IP string or IpAdddress objects stored in a pandas DataFrame.
The format_ip_entity function converts the IP string value to
an IpAddress object, looks up the geo-location (this data is populated
into the IpAddress Location attribute). It also adds additional
information from the pandas DataFrame into the AdditionalData attribute.
Values populated here will be displayed in the tooltip for each plotted
IP Address on the map.
Note
The values populated into the AdditionalData attribute are specific to this example. AdditionalData is a dictionary object so you can put data keyed with a string name here. Primitive value types such as string, numbers, dates, etc. should display correctly.
# Create a IP Geolookup class
iplocation = GeoLiteLookup()

def format_ip_entity(row, ip_col):
    ip_entity = entities.IpAddress(Address=row[ip_col])
    iplocation.lookup_ip(ip_entity=ip_entity)
    ip_entity.AdditionalData["protocol"] = row.L7Protocol
    if "severity" in row:
        ip_entity.AdditionalData["threat severity"] = row["severity"]
    if "Details" in row:
        ip_entity.AdditionalData["threat details"] = row["Details"]
    return ip_entity

ips_out = list(selected_out.apply(lambda x: format_ip_entity(x, "dest"), axis=1))
ips_in = list(selected_in.apply(lambda x: format_ip_entity(x, "source"), axis=1))
ips_threats = list(ti_ip_results.apply(lambda x: format_ip_entity(x, "Ioc"), axis=1))

icon_props = {"color": "green"}
for ips in host_entity.public_ips:
    ips.AdditionalData["host"] = host_entity.HostName
folium_map.add_ip_cluster(ip_entities=host_entity.public_ips, **icon_props)
icon_props = {"color": "blue"}
folium_map.add_ip_cluster(ip_entities=ips_out, **icon_props)
icon_props = {"color": "purple"}
folium_map.add_ip_cluster(ip_entities=ips_in, **icon_props)
icon_props = {"color": "red"}
folium_map.add_ip_cluster(ip_entities=ips_threats, **icon_props)

display(folium_map)