ProcessTree
This describes the use of the process tree data and visualization modules. These modules can be used with either Windows process creation events (ID 4688) or Linux auditd logs. The ProcessTree visualization is built using the Bokeh library.
See the sample ProcessTree Notebook for full code for the examples shown here.
The process tree functionality has two main components:
- Process Tree creation - this takes a standard log from a single host and builds the parent-child relationships between processes in the data set. There are a set of utility functions to extract individual and partial trees from the processed data set.
- Process Tree visualization - this takes the processed output from the previous component and displays the process tree using Bokeh plots.
Note
The expected schema for the Linux audit data is as produced
by the auditdextract.py module in msticpy. This module
combines related process exec messages into a single combined message
that emulates the Windows 4688 event. This retains the audit schema
apart from the following additions:
cmdline: this is a concatenation of thea0,a1, etc argument fieldsEventType: this is the audit message type (SYSCALL,EXECVE,CWD, etc.) - the combinedSYSCALL_EXECVEcreated byauditextractis the only type currently supported.
Support for other formats such as Sysmon, Microsoft Defender is planned but not yet included.
Extracting process trees from logs
The input can be either Windows 4688 events or Linux audit events (with the above caveats).
build_process_tree syntax
See build_process_tree
from mstipy.sectools import *
ptree.build_process_tree(procs, schema=None, show_progress=False, debug=False)
Parameters
- procs (pd.DataFrame)
- Process events (Windows 4688 or Linux Auditd)
- schema (ProcSchema, optional)
- The column schema to use, by default None If None, then the schema is inferred
- show_progress (bool, optional)
- Shows the progress of the process (helpful for very large data sets)
- debug (bool, optional)
- If True produces extra debugging output, by default False
The following example shows importing the require modules and reading in
test data.
We then call build_process_tree to extract the parent-child relationships
between processes.
from IPython.display import display
import pandas as pd
from msticpy.nbtools import *
from msticpy.sectools import *

win_procs = pd.read_pickle("../demos/data/win_proc_test.pkl")
p_tree_win = ptree.build_process_tree(win_procs, show_progress=True)
The default output returns some statistics about the processed data.
{'Processes': 1010, 'RootProcesses': 10, 'LeafProcesses': 815, 'BranchProcesses': 185, 'IsolatedProcesses': 0, 'LargestTreeDepth': 7}
Process Tree utils module
The module is imported as follows:
from msticpy.sectools import *
or explicitly
from msticpy.sectools import process_tree_utils as ptree
The module contains functions for building the parent-child relations as well as a number of utility functions for manipulating and extracting the trees. Most of these are described in the later section Process Tree utility functions.
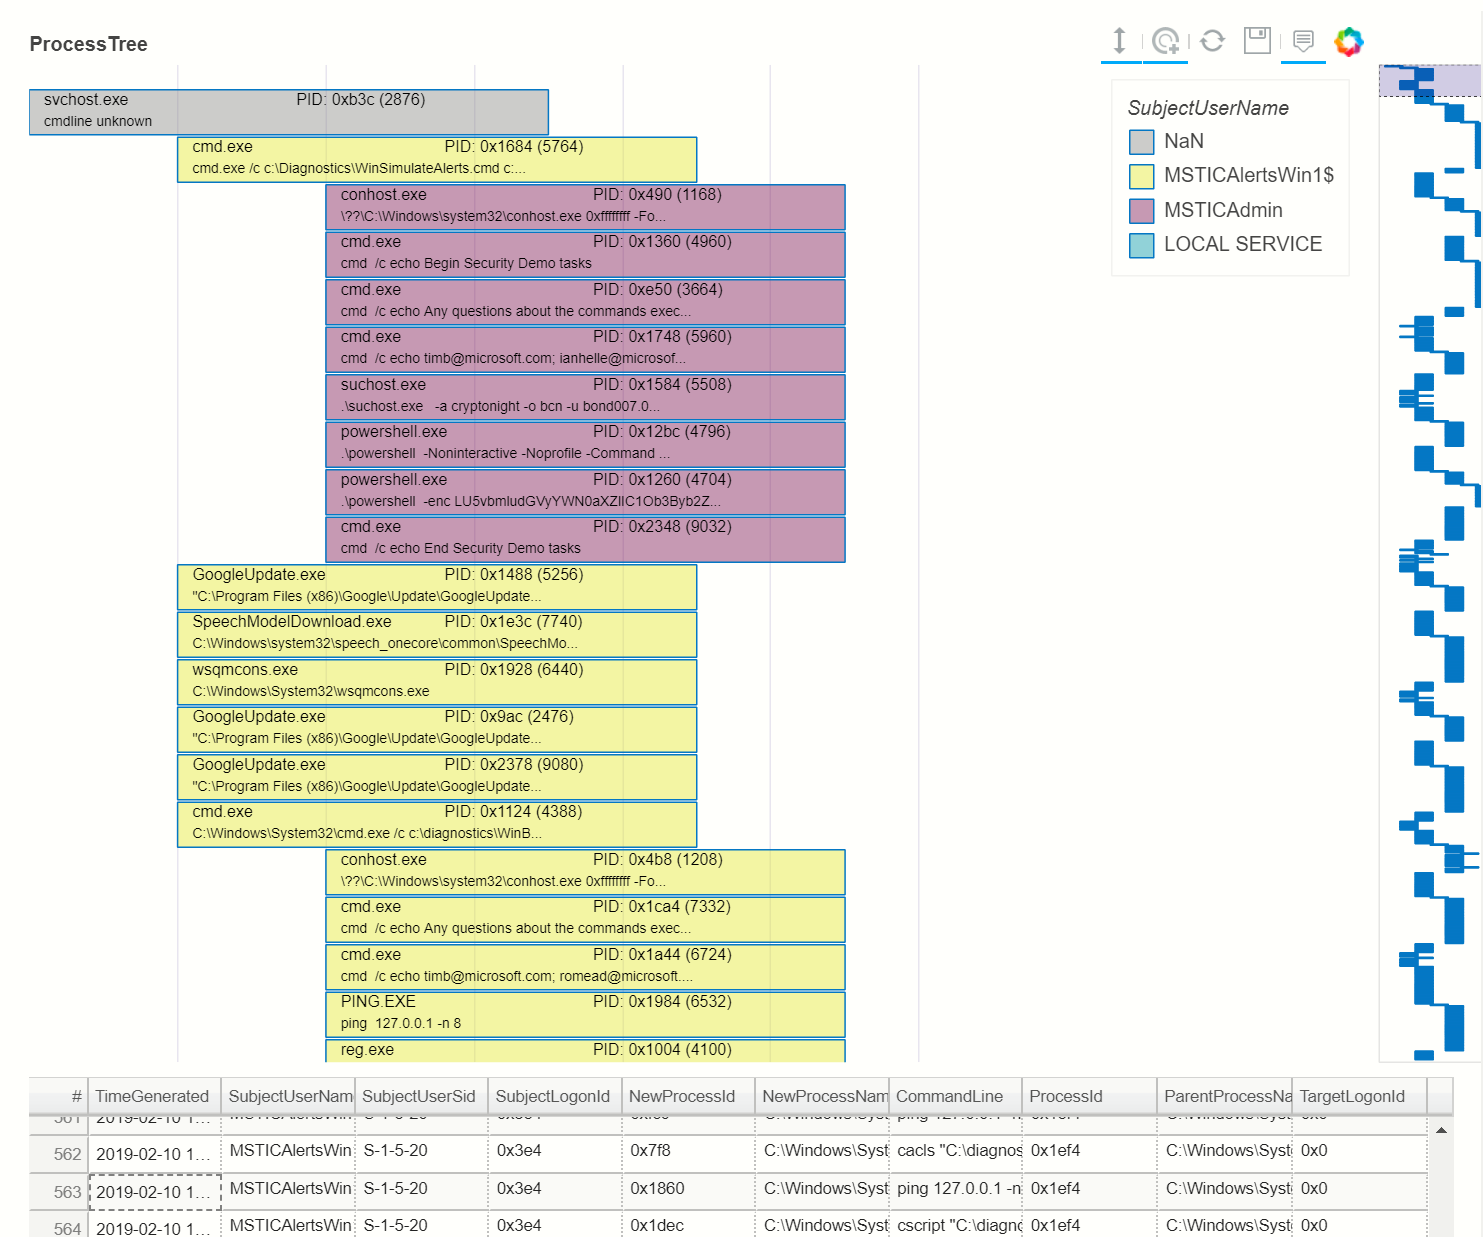
Plotting a Process Tree
proc_tree = ptree.get_descendents(p_tree_win, ptree.get_roots(p_tree_win).iloc[2])
nbdisplay.plot_process_tree(data=proc_tree, legend_col="SubjectUserName", show_table=True)
Plotting Syntax
See
plot_process_tree
and
build_and_show_process_tree
nbdisplay.plot_process_tree( data, schema=None, output_var=None,
legend_colNone, show_table=False, )
Parameter descriptions
- data (pd.DataFrame)
- DataFrame containing one or more Process Trees. This should be the
output of
build_process_treedescribed above. - schema (ProcSchema, optional)
- The data schema to use for the data set, by default None. If None
the schema is inferred. A schema object maps generic field names
(e.g.
process_name) on to a data-specific name (e.g.exein the case of Linux audit data). This is usually not required since the function will try to infer the schema from fields in the input DataFrame. - output_var (str, optional)
- Output variable for selected items in the tree, by default None.
Setting this lets you return the keys of any items selected in the
bokeh plot. For example, if you supply the string “my_results” and
then select one or more processes in the tree, the Python variable
my_resultswill be populated with a list of keys (index items) of the corresponding rows in the input DataFrame. - legend_col (str, optional)
- The column used to color the tree items, by default None. If this column is a string, the values will be treated as categorical data and map unique values to different colors and display a legend of the mapping. If this column is a numeric or datetime value, the values will be treated as continuous and a color gradient bar will be displayed indicating the mapping of values on to the color gradient.
- show_table (bool)
- Set to True to show the data table, by default False. Shows the source values as a data table beneath the process tree.
Warning
Large data sets (more than a few hundred processses)
These will normally be handled well by the Bokeh plot (up to multiple tens of thousands or more) but it will make navigation of the tree difficult. In particular, the range tool (on the right of the main plot) will be difficult to manipulate. Split the input data into smaller chunks before plotting.
Note
Range Tool and Font Size
Avoid using Range tool to change the size of the displayed plot.
The font size does not scale based on how much data is shown. If you
use the range tool to select too large a subset of the data in the
main plot, the font will become unreadable. If this happens, use the
reset tool to set the plot back to its defaults. Dragging the
range box along the tree, rather than dragging individual edges
(resulting in resizing the range) will give more readable results.
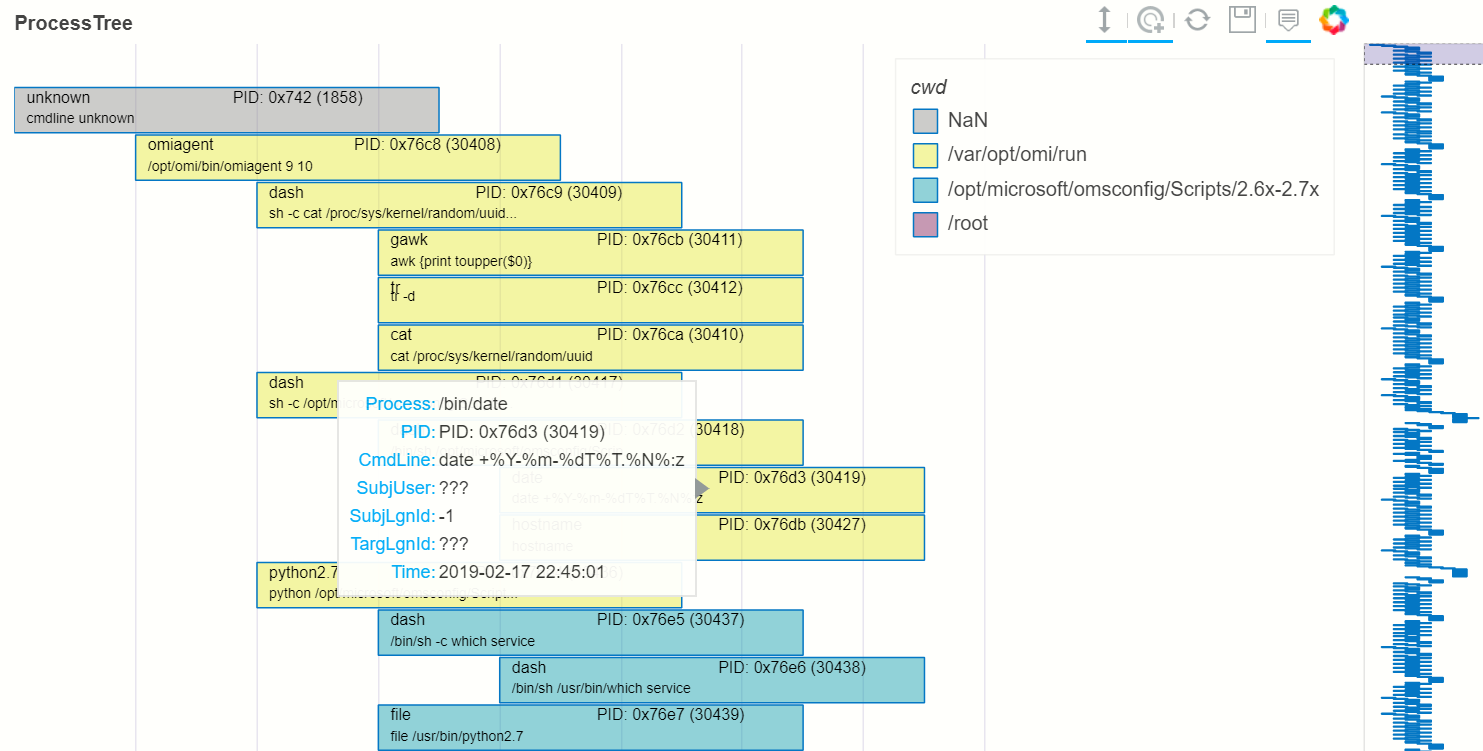
Linux Process Tree
The process for visualizing Linux process trees is almost identical to visualizing Windows processes.
Note This assumes that the Linux audit log has been read from a
file using
read_from_file
or read from Azure Sentinel/Log Analytics using the
LinuxAudit.auditd_all query and processed using
extract_events_to_df
function.
Using either of these, the audit messages events related to a single process start are merged into a single row.
See :doc: ../data_acquisition/CollectingLinuxAuditLogs.rst for more details.
# Process Linux audit events. Show verbose output.

p_tree_lx = ptree.build_process_tree(linux_proc, show_progress=True, debug=True)
Original # procs 34345
Merged # procs 34345
Merged # procs - dropna 11868
Unique merged_procs index in merge 34345
These two should add up to top line
Rows with dups 0
Rows with no dups 34345
0 + 34345 = 34345
original: 34345 inferred_parents 849 combined 35194
has parent time 20177
effectivelogonId in subjectlogonId 35190
parent_proc_lc in procs 34345
ProcessId in ParentProcessId 21431
Parent_key in proc_key 34345
Parent_key not in proc_key 845
Parent_key is NA 845
{'Processes': 35190, 'RootProcesses': 845, 'LeafProcesses': 17664, 'BranchProcesses': 16681, 'IsolatedProcesses': 0, 'LargestTreeDepth': 10}
# Take one of the roots from the process set and get the full tree beneath it
t_root = ptree.get_roots(p_tree_lx).iloc[7]
full_tree = ptree.get_descendents(p_tree_lx, t_root)
print("Full tree size:", len(full_tree))
Full tree size: 3032
nbdisplay.plot_process_tree(data=full_tree[:1000], legend_col="cwd")
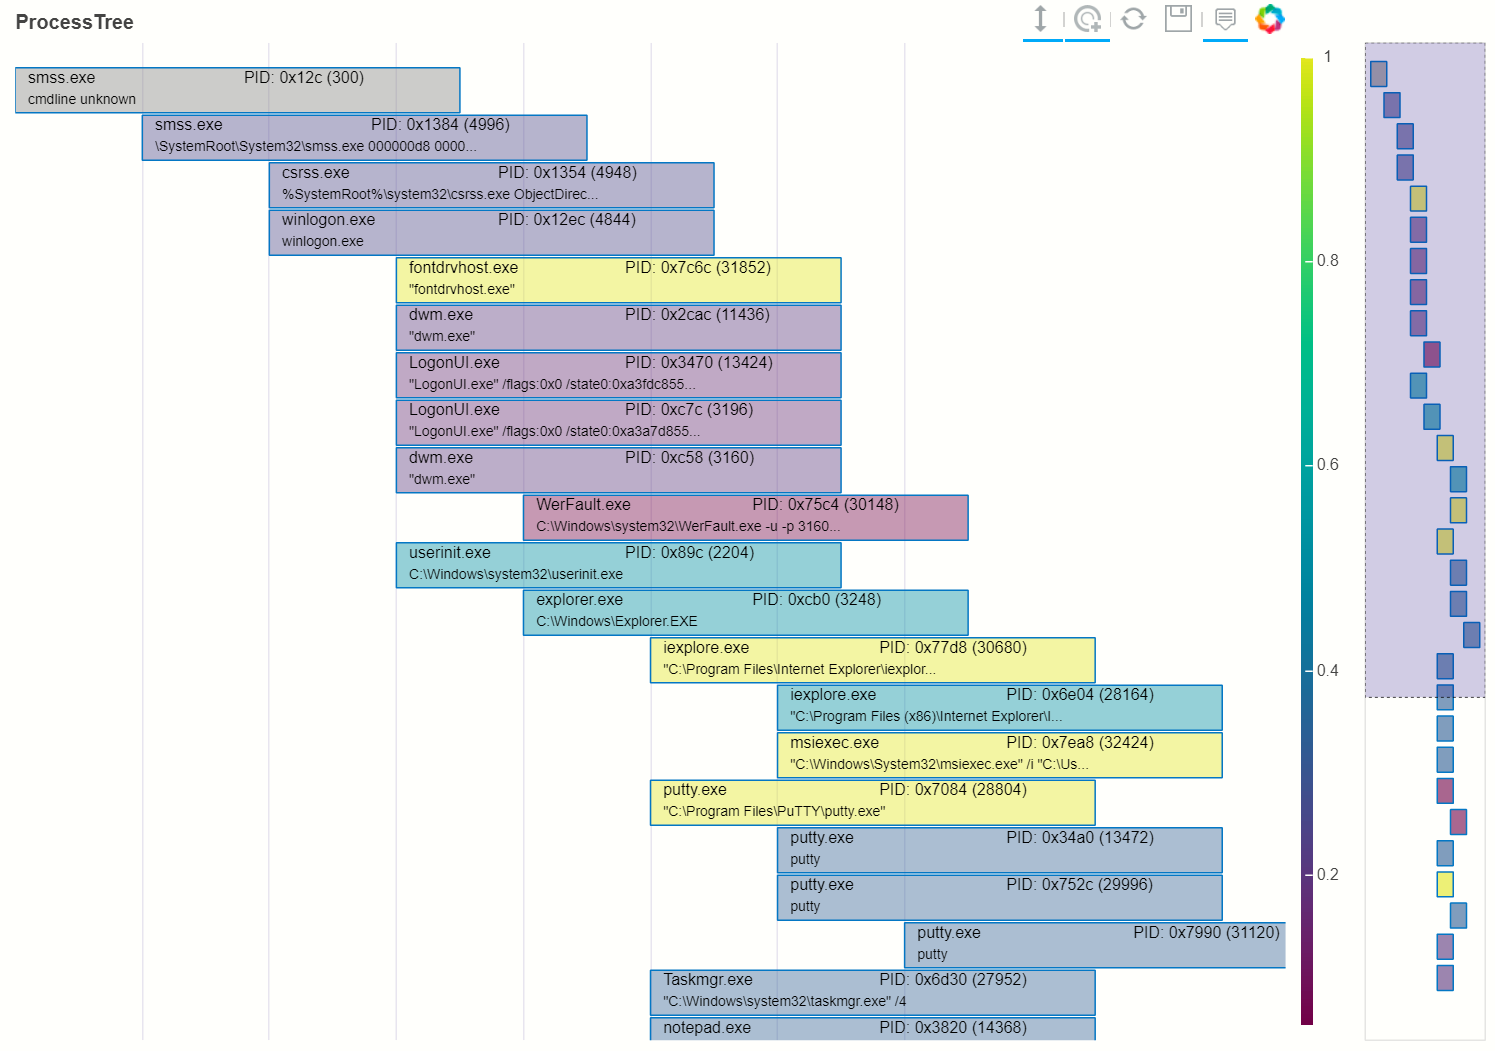
Plotting Using a color gradient
# Read in and process some data - this contains a Rarity column indicating
# how common the process is in analyzed data set.
proc_rarity = pd.read_pickle("../demos/data/procs_with_cluster.pkl")
proc_rarity_tree = ptree.build_process_tree(proc_rarity, show_progress=True)
{'Processes': 22992, 'RootProcesses': 31, 'LeafProcesses': 15587, 'BranchProcesses': 7374, 'IsolatedProcesses': 0, 'LargestTreeDepth': 839}
# Get the root processes from the process tree data
prar_roots = ptree.get_roots(proc_rarity_tree)

# Find the tree with the highest Rarity Score and
# calculate the AverageRarity for proceses in that tree.
# NOTE: this code is only needed to help us choose likely trees to view
# it is not needed for the plotting.
tree_rarity = []
for row_num, (ix, row) in enumerate(prar_roots.iterrows()):
    rarity_tree = ptree.get_descendents(proc_rarity_tree, row)
    tree_rarity.append({
        "Row": row_num,
        "RootProcess": prar_roots.loc[ix].NewProcessName,
        "TreeSize:": len(rarity_tree),
        "AverageRarity": rarity_tree["Rarity"].mean()
    })

pd.DataFrame(tree_rarity).sort_values("AverageRarity", ascending=False)
    Row                                        RootProcess  TreeSize:
27   27                    C:\Windows\System32\svchost.exe          4
23   23                    C:\Windows\System32\svchost.exe          2
22   22                       C:\Windows\System32\smss.exe         30
20   20  C:\Windows\SoftwareDistribution\Download\Insta...          2
9     9                       C:\Windows\System32\smss.exe          7
7     7  C:\ProgramData\Microsoft\Windows Defender\plat...         46
....
# Plot the tree using the Rarity column as the legend_col parameter.
svcs_tree = ptree.get_descendents(proc_rarity_tree, prar_roots.iloc[22])
nbdisplay.plot_process_tree(svcs_tree, legend_col="Rarity", show_table=True)
Process Tree utility Functions
The process_tree_utils
module has a number of functions that may
be useful in extracting or manipulating process trees or tree
relationships.
These typically take a procs parameter - the DataFrame containing
the process trees.
Processes that perform navigation relative to another process (get_parent,
get_children, etc.) also take a source parameter - the process that is
the origin of the navigation.
Some functions also have an include_source parameter, e.g. get_children.
This controls whether the function will include the source process in the results.
Functions:
build_process_keybuild_process_treeget_ancestorsget_childrenget_descendentsget_parentget_processget_process_keyget_rootget_root_treeget_rootsget_siblingsget_summary_infoget_tree_depthinfer_schema
get_summary_info()
Get summary information.
ptree.get_summary_info(p_tree_win)
{'Processes': 1010,
 'RootProcesses': 10,
 'LeafProcesses': 815,
 'BranchProcesses': 185,
 'IsolatedProcesses': 0,
 'LargestTreeDepth': 7}
get_roots()
Get roots of all trees in the data set.
# Get roots of all trees in the set
ptree.get_roots(p_tree_win).head()
get_descendents()
Get the full tree beneath a process.
get_descendents takes an include_source parameter. Setting this to
True returns the source process with the result set.
# Take one of those roots and get the full tree beneath it
t_root = ptree.get_roots(p_tree_win).loc["c:\windowsazure\guestagent_2.7.41491.901_2019-01-14_202614\waappagent.exe0x19941970-01-01 00:00:00.000000"]
full_tree = ptree.get_descendents(p_tree_win, t_root)
full_tree.head()
get_children()
Get the immediate children of a process
get_children takes an include_source parameter. Setting this to
True returns the source process with the result set.
# Just get the immediate children of the root process
children = ptree.get_children(p_tree_win, t_root)
children.head()
get_tree_depth()
Get the depth of a tree.
# Get the depth of the full tree
depth = ptree.get_tree_depth(full_tree)
print(f"depth of tree is {depth}")
depth of tree is 4
get_ancestors()
Get the parent process or all ancestors.
get_ancestors takes an include_source parameter. Setting this to
True returns the source process with the result set.
# Get Ancestors
# Get a child process that's at the bottom of the tree
btm_descnt = full_tree[full_tree["path"].str.count("/") == depth - 1].iloc[0]

print("parent")
display(ptree.get_parent(p_tree_win, btm_descnt)[:20])
print("ancestors")
ptree.get_ancestors(p_tree_win, btm_descnt).head()
parent


TenantId                           52b1ab41-869e-4138-9e40-2a4457f09bf0
Account                                      WORKGROUP\MSTICAlertsWin1$
EventID                                                            4688
TimeGenerated                                2019-02-09 23:20:15.547000
Computer                                                MSTICAlertsWin1
SubjectUserSid                                                 S-1-5-18
SubjectUserName                                        MSTICAlertsWin1$
SubjectDomainName                                             WORKGROUP
SubjectLogonId                                                    0x3e7
NewProcessId                                                      0xccc
NewProcessName                              C:\Windows\System32\cmd.exe
TokenElevationType                                               %%1936
ProcessId                                                        0x123c
CommandLine                                                       "cmd"
ParentProcessName     C:\WindowsAzure\GuestAgent_2.7.41491.901_2019-...
TargetLogonId                                                       0x0
SourceComputerId                   263a788b-6526-4cdc-8ed9-d79402fe4aa0
TimeCreatedUtc                               2019-02-09 23:20:15.547000
EffectiveLogonId                                                  0x3e7
new_process_lc                              c:\windows\system32\cmd.exe
Name: c:\windows\system32\cmd.exe0xccc2019-02-09 23:20:15.547000, dtype: object
ancestors

                                                                                TenantId  \
proc_key
c:\windowsazure\guestagent_2.7.41491.901_2019-0...  52b1ab41-869e-4138-9e40-2a4457f09bf0
c:\windowsazure\guestagent_2.7.41491.901_2019-0...  52b1ab41-869e-4138-9e40-2a4457f09bf0
c:\windows\system32\cmd.exe0xccc2019-02-09 23:2...  52b1ab41-869e-4138-9e40-2a4457f09bf0
c:\windows\system32\conhost.exe0x14ec2019-02-09...  52b1ab41-869e-4138-9e40-2a4457f09bf0

....

[4 rows x 35 columns]
build_process_key()
get_process retrieves a process record by its key. build_process_key creates and returns a process key from a process object. The latter may be useful if have a process record from another data set that you want to find in the process tree data.
In both cases the process returned is a single row - a pandas Series.
proc_key = btm_descnt.name
print(proc_key)
ptree.get_process(p_tree_win, proc_key)
c:\windows\system32\conhost.exe0x14ec2019-02-09 23:20:15.560000
process2 = full_tree[full_tree["path"].str.count("/") == depth - 1].iloc[-1]
ptree.build_process_key(process2)
'c:\\windows\\system32\\conhost.exe0x15842019-02-10 15:24:56.050000'
get_siblings()
Get the siblings of a process.
get_siblings takes an include_source parameter. Setting this to
True returns the source process with the result set.
src_proc = ptree.get_children(p_tree_win, t_root, include_source=False).iloc[0]
ptree.get_siblings(p_tree_win, src_proc, include_source=True).head()
                                                                                TenantId  \
proc_key
c:\windowsazure\guestagent_2.7.41491.901_2019-0...  52b1ab41-869e-4138-9e40-2a4457f09bf0
c:\windowsazure\guestagent_2.7.41491.901_2019-0...  52b1ab41-869e-4138-9e40-2a4457f09bf0
c:\windowsazure\secagent\wasecagentprov.exe0xda...  52b1ab41-869e-4138-9e40-2a4457f09bf0
...

[5 rows x 35 columns]
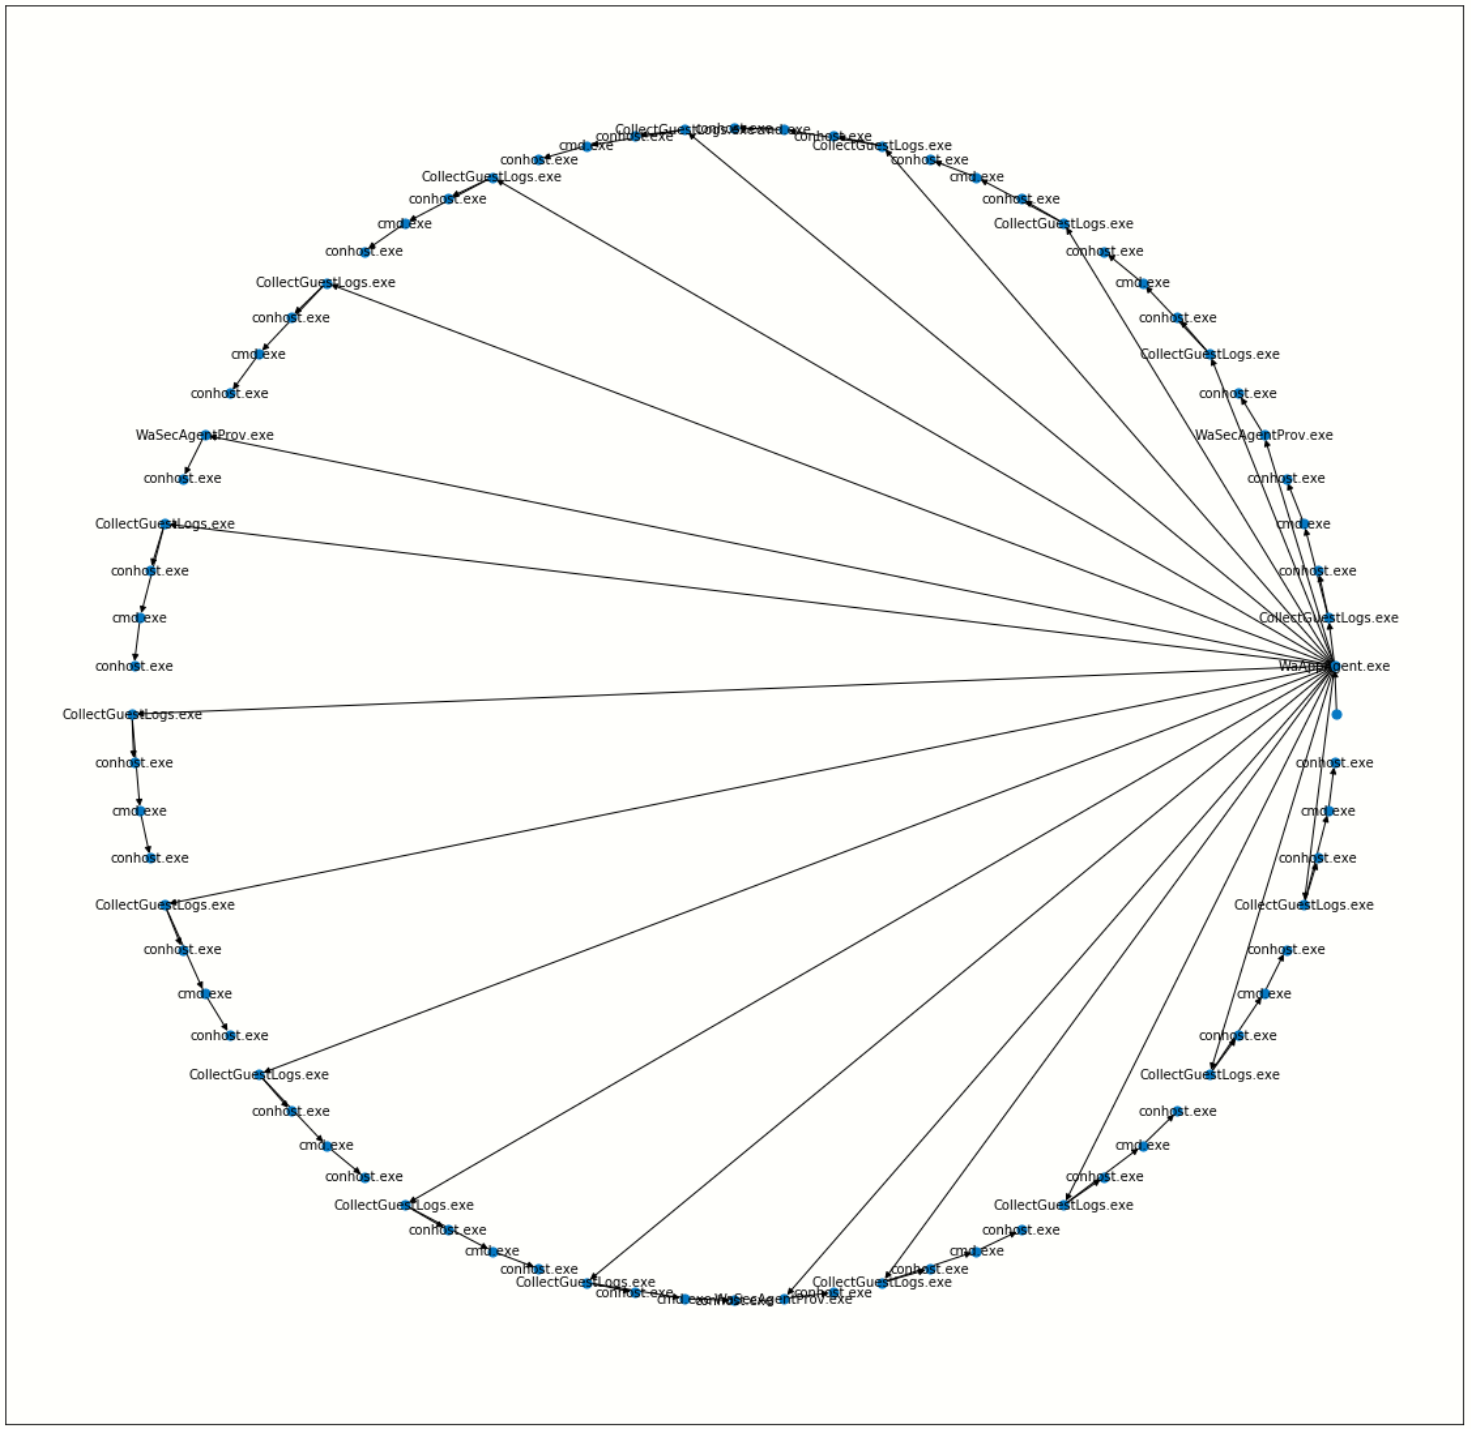
Create a network from a Tree using Networkx
import networkx as nx
import matplotlib.pyplot as plt
p_graph = nx.DiGraph()

p_graph = nx.from_pandas_edgelist(
    df=full_tree.reset_index(),
    source="parent_key",
    target="proc_key",
    edge_attr=["TimeGenerated", "NewProcessName", "NewProcessId"],
    create_using=nx.DiGraph,
)

plt.gcf().set_size_inches((20,20))
pos = nx.circular_layout(p_graph)
nx.draw_networkx(p_graph, pos=pos, with_labels=False, node_size=50, fig_size=(10,10))
# Get the root binary name to plot labels (change the split param for Linux)
labels = full_tree.apply(lambda x: x.NewProcessName.split("\\")[-1], axis=1).to_dict()
nx.draw_networkx_labels(p_graph, pos, labels=labels, font_size=10, font_color='k', font_family='sans-serif', font_weight='normal', alpha=1.0)
plt.show()