Setting up Process Auditing for Linux in Azure Sentinel
This is a provisional set of instructions for the preview release of Azure Sentinel.
Add your Linux VMs to the Log Analytics Workspace
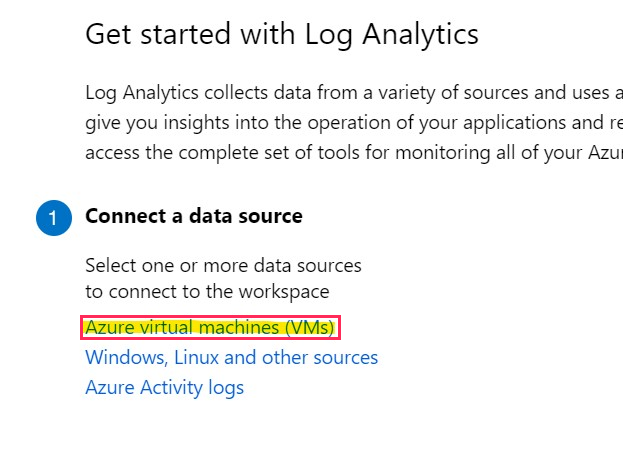
Browse to the Log Analytics blade for your workspace and select the option to configure your Azure virtual machines.
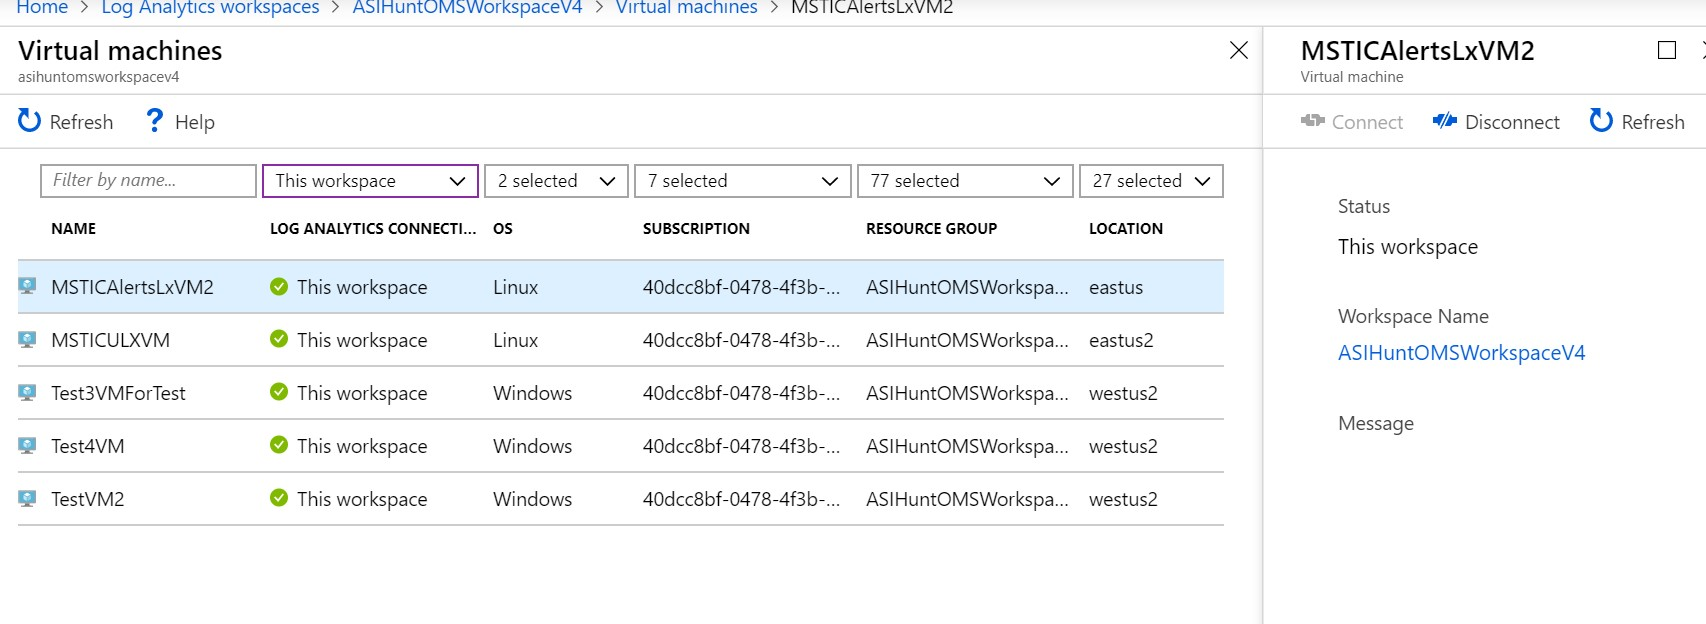
This brings up a list of Virtual machines which you can connect and disconnect from Log Analytics. Click on the Connect icon to add the Log Analytics data collection agent.
Configure Auditing on your Linux VMs
Follow the instructions at Configuring and auditing Linux systems with Audit daemon
Add audit filter rules to capture successful process executions
$ sudo auditctl -a always,exit -F arch=b32 -S execve,execveat
$ sudo auditctl -a always,exit -F arch=b64 -S execve,execveat
Your rules should look something like this when added
$ sudo auditctl -l
-w /bin/kmod -p x -k kernelmodules
-w /var/log/audit -p wxa -k audittampering
-w /etc/audit -p wxa -k audittampering
-w /etc/passwd -p wxa -k usergroup
-w /etc/group -p wxa -k usergroup
-w /etc/pam.d -p wxa -k pam
-a always,exit -F arch=b32 -S execve,execveat
-a always,exit -F arch=b64 -S execve,execveat
See Scott Pack’s blog auditd By Example - Monitoring Process Execution
After a few minutes (or hours depending on how busy your hosts are), save a sample from your audit log. A few hundred lines is probably enough.
$ sudo tail -500 /var/log/audit/audit.log > ~/auditsample.txt
You will need to copy this file to whereever you run the next step from.
Add Auditd as a Custom log in Log Analytics
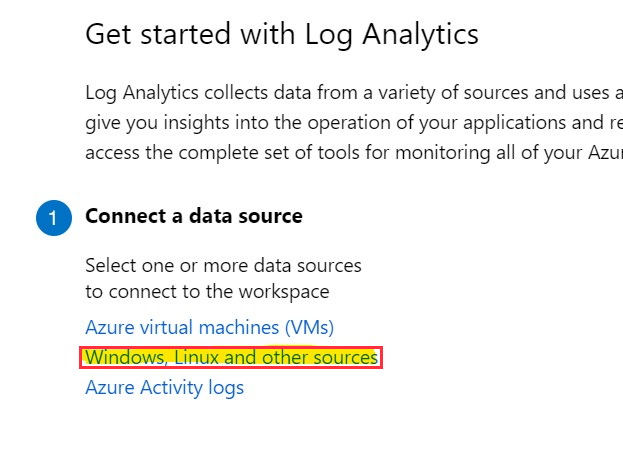
Go back to your Log Analytics configuration blade and choose the “Windows, Linux and other sources” option.
Now add a custom log type.
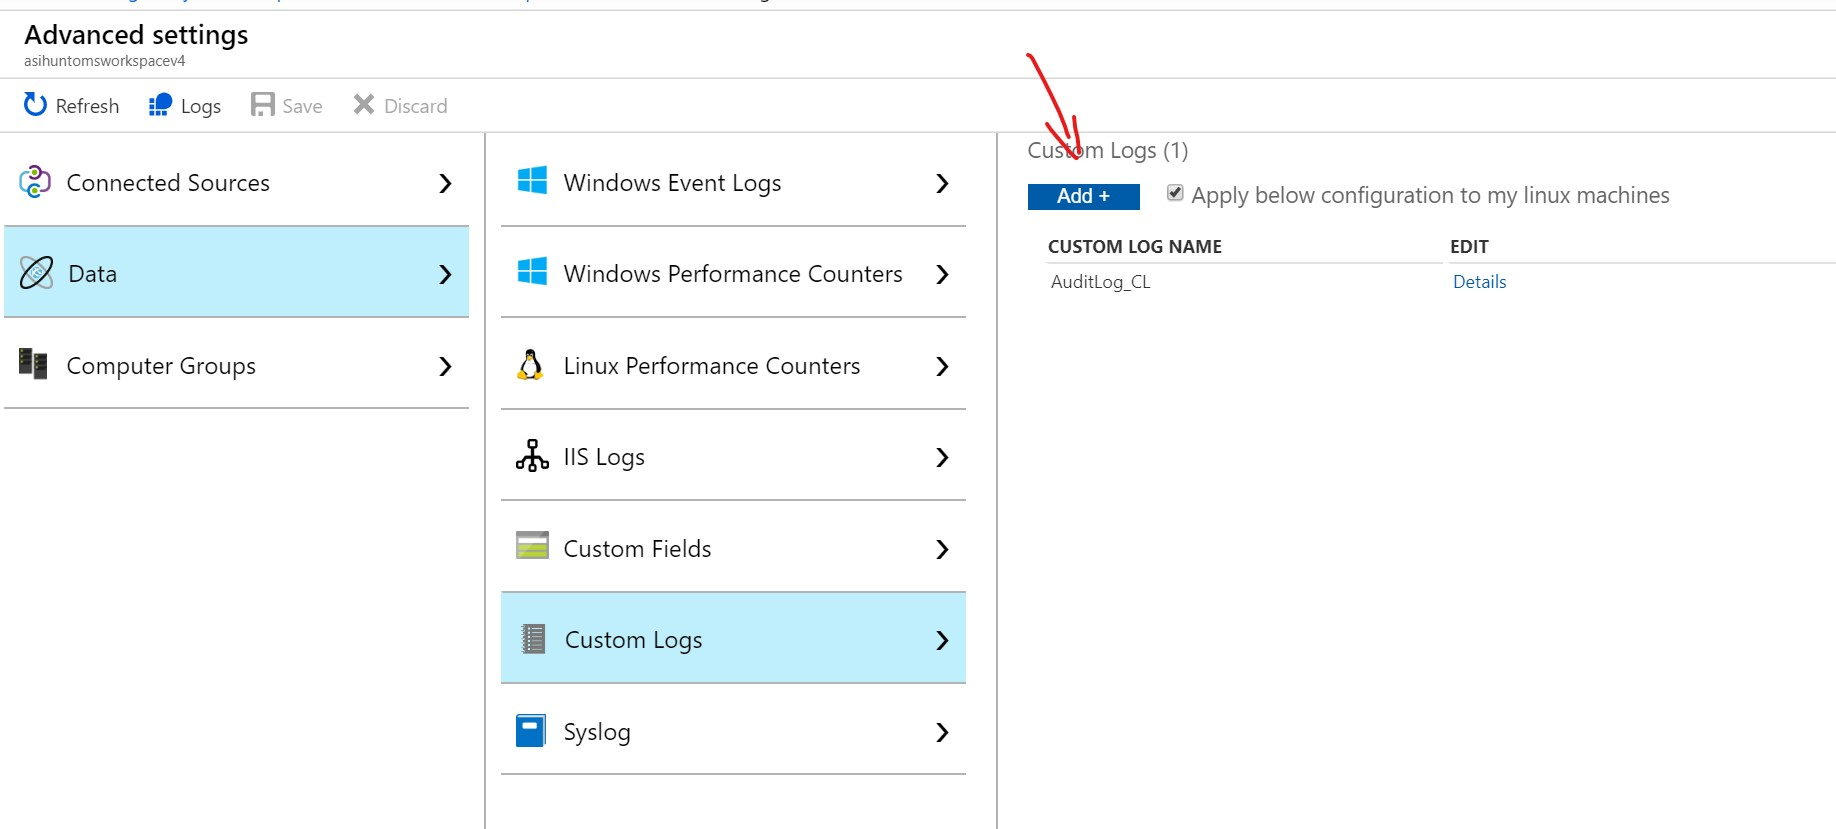
Click the Add+ button and follow the steps
- Upload your audit log sample
- Select New Line as the record delimiter
- Add the path to the audit log (select Linux as the type)
/var/log/audit/audit.log - Add a name (e.g. Auditlog_CL) and description
In a while (logs are harvested every hour) you should see a log in Custom Logs showing up in Log Analytics.
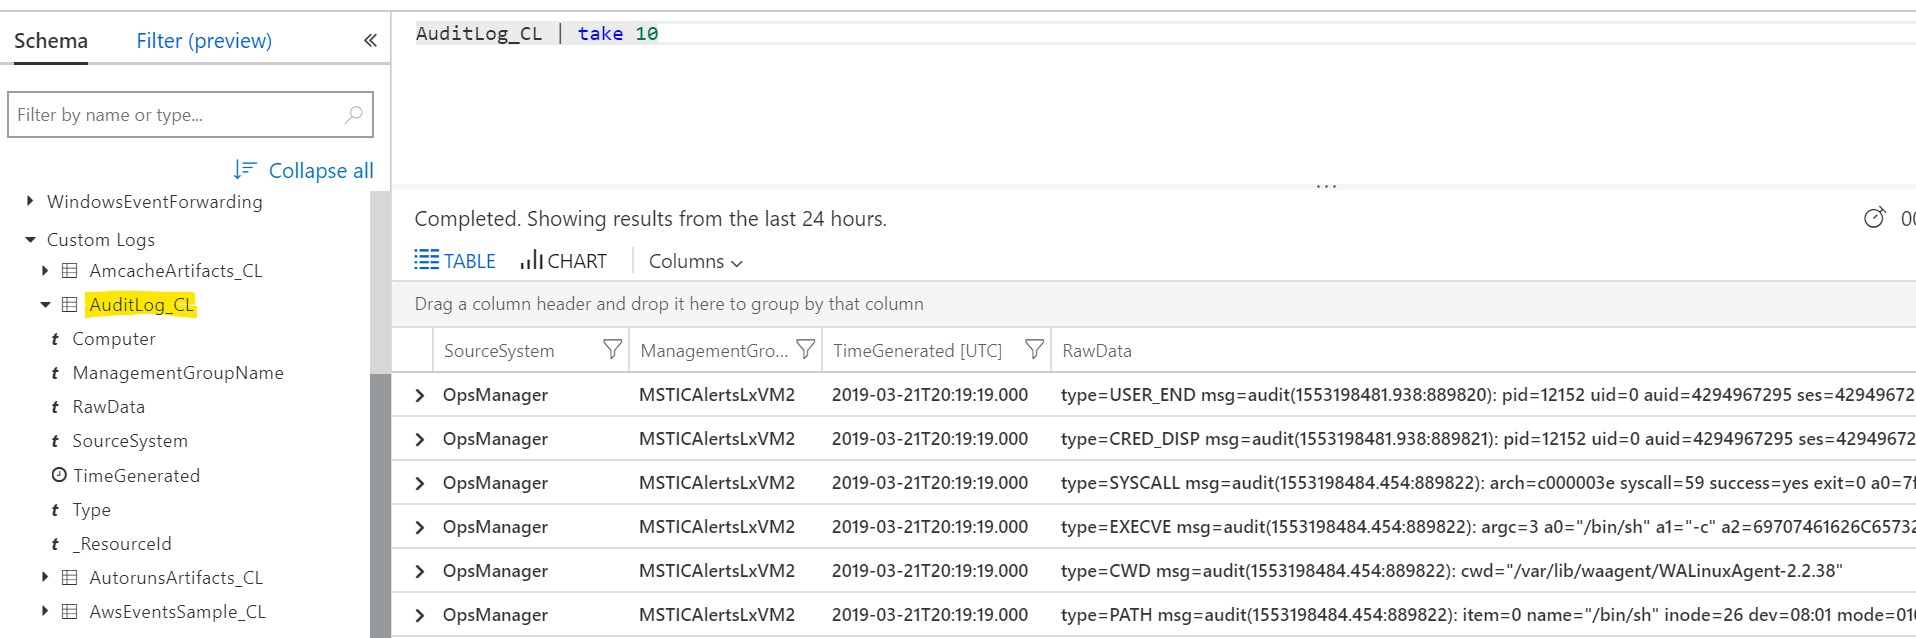
At this stage the logs are both verbose (e.g. a process creation event will result in 5 or more audit entries) and not always useful to a casual browser. Several fields are hex encoded (to prevent problems with embedded strings and spaces) and the timestamp of the actual event (as opposed to the TimeGenerated field, which records the log ingestion time) is a Unix timestamp (number of seconds since 1/1/1970). You can use audit tools such as aureport to decode and make sense of the logs.
The msticpy library contains a module to decode and reorganize auditd logs from Log Analytics.
Reading Audit Data from Log Analytics
We can do part of the work using Kusto query language (KQL). This example uses a Kql query executed by KqlMagic in Python.
1 2 3 4 5 6 7 8 9 10 11 12 13 14 15 16 17 18 19 | linux_events = r'''
AuditLog_CL
| where Computer has '{hostname}'
| where TimeGenerated >= datetime({start})
| where TimeGenerated <= datetime({end})
| extend mssg_parts = extract_all(@"type=(?P<type>[^\s]+)\s+msg=audit\((?P<mssg_id>[^)]+)\):\s+(?P<mssg>[^\r]+)\r?",
dynamic(['type', 'mssg_id', 'mssg']), RawData)
| extend mssg_type = tostring(mssg_parts[0][0]), mssg_id = tostring(mssg_parts[0][1])
| project TenantId, TimeGenerated, Computer, mssg_type, mssg_id, mssg_parts
| extend mssg_content = split(mssg_parts[0][2],' ')
| extend typed_mssg = pack(mssg_type, mssg_content)
| summarize AuditdMessage = makelist(typed_mssg) by TenantId,
TimeGenerated, Computer, mssg_id
'''.format(start=host1_q_times.start, end=host1_q_times.end,
hostname=security_alert.hostname)
print('getting data...')
%kql -query linux_events
linux_events_df = _kql_raw_result_.to_dataframe()
print(f'{len(linux_events_df)} raw auditd mssgs downloaded')
|
An explanation of some more involved lines of the query:
- lines 6-8: Split the rawdata field into message type, message Id and timestamp and message data fields
- line 9: get rid of unwanted columns
- line 10: split the message body into an array of key=value strings
- line 11: pack the message type and list of contents into a dictionary {‘Type’: [k1=v1, k2=v2…]}
- line 12-13: group by messageId and pack the individual typed_mssg dictionaries into a list of dictionaries
The processing library is used as follows. Note with large data sets this can take some time to process.
from msticpy.sectools.auditdextract import extract_events_to_df, get_event_subset
linux_events_all = extract_events_to_df(linux_events_df, verbose=True)
The call to extract_events_to_df() does the following:
- splits the
key=valuestring - hex decoding of any encoded strings
- type conversion for int fields
- for SYSCALL/EXECVE rows, some extract processing to identify the executable that ran and re-assemble the commandline arguments
- extracts the real timestamp and replacing the original TimeGenerated columns (since this was just the log import time, not the event time, which is what we are after)
This example splits out Process call and Login events into two separate data streams:
lx_proc_create = get_event_subset(linux_events_all,'SYSCALL_EXECVE')
print(f'{len(lx_proc_create)} Process Create Events')

lx_login = (get_event_subset(linux_events_all, 'LOGIN')
        .merge(get_event_subset(linux_events_all, 'CRED_ACQ'),
            how='inner',
            left_on=['old-ses', 'pid', 'uid'],
            right_on=['ses', 'pid', 'uid'],
            suffixes=('', '_cred')).drop(['old-ses','TenantId_cred',
                                            'Computer_cred'], axis=1)
        .dropna(axis=1, how='all'))
print(f'{len(lx_login)} Login Events')
You can also use the auditdextract module to extract raw text logs. See the module help for more information.