Pivot Functions
What are Pivot Functions?
MSTICPy has a lot of functionality distributed across many classes and modules. However, there is no simple way to discover where these functions are and what types of data the function is relevant to.
Pivot functions do not implement any new InfoSec functionality. Instead they wrap existing MSTICPy functions and classes and make them easier to discover and use. They also standardize the parameters, syntax and output format for these functions.
Pivot functions bring this functionality together grouped around Entities. Entities are representations of real-world objects found commonly in CyberSec investigations. Some examples are: IpAddress, Host, Account, URL.
The pivot functions are attached to the entities most relevant to that operation. E.g. IP geo-location lookup is a method of the IpAddress entity. The functions are also grouped into logical containers. You can see some examples here of functions being run on the IpAddress entity in the “util” group.
>>> IpAddress.util.ip_type(ip_str="157.53.1.1"))
ip          result
157.53.1.1  Public


>>> IpAddress.util.whois("157.53.1.1"))
asn  asn_cidr  asn_country_code  asn_date    asn_description  asn_registry  nets .....
NA   NA        US                2015-04-01  NA               arin          [{'cidr': '157.53.0.0/16'...

>>> IpAddress.util.geoloc(value="157.53.1.1"))
CountryCode  CountryName    State   City   Longitude   Latitude   Asn...
US           United States  None    None   -97.822     37.751     None...
This second example shows a pivot function that does a data query for host entities. The “list_host_logons” function is an AzureSentinel query. If you have queries for other environments such as Splunk or MDE, these appear in their own containers.
>>> Host.AzureSentinel.list_host_logons(host_name="VictimPc")
Account               EventID   TimeGenerated                      Computer                 SubjectUserName   SubjectDomainName
NT AUTHORITYSYSTEM   4624      2020-10-01 22:39:36.987000+00:00   VictimPc.Contoso.Azure   VictimPc$         CONTOSO
NT AUTHORITYSYSTEM   4624      2020-10-01 22:39:37.220000+00:00   VictimPc.Contoso.Azure   VictimPc$         CONTOSO
NT AUTHORITYSYSTEM   4624      2020-10-01 22:39:42.603000+00:00   VictimPc.Contoso.Azure   VictimPc$         CONTOSO
You can also chain pivot functions together using pandas to create a processing pipeline that does multiple operations on data:
>>> (
        # take a list of IP Addresses
        suspicious_ips_df
        # Lookup IPs at VirusTotal
        .mp_pivot.run(IpAddress.ti.lookup_ipv4_VirusTotal, column="IPAddress")
        # Filter on high severity TI hits
        .query("Severity == 'high'")
        # Find who owns these IPs
        .mp_pivot.run(IpAddress.util.whois, column="Ioc", join="left")
        # Query IPs that have login attempts in our AAD
        .mp_pivot.run(IpAddress.AzureSentinel.list_aad_signins_for_ip, ip_address_list="Ioc")
        # Send the output of this to a plot
        .mp_plot.timeline.plot(
            title="High Severity IPs with Logon attempts",
            source_columns=["UserPrincipalName", "IPAddress", "ResultType", "ClientAppUsed", "UserAgent", "Location"],
            group_by="UserPrincipalName"
        )
    )
Note
We’ll see many more examples of how to do these pivoting operations later in the document.
The pivot functionality exposes operations relevant to a particular entity as methods (or functions) of that entity. These operations include:
Data queries
Threat intelligence lookups
Other data lookups such as geo-location or domain resolution
and other local functionality
The pivot library essentially wraps this existing functionality in a more standardized form. This gives us several benefits:
You can more easily find functions related to what you are working on.
You can discover functionality that you weren’t previously aware of.
The functions have standardized input and output.
The functions will take input data in a number of different formats so you don’t waste time wrangling data to suit the function you want to use.
For functions that require a time range (e.g. queries) the time range is set centrally and used by all functions (you can change this time range at any time, of course, as well as override it by supplying time parameters in the function call).
Sample notebooks
You can view and try out two notebooks illustrating the use of pivot functions:
[PivotFunctions-Introduction](https://github.com/microsoft/msticpy/blob/main/docs/notebooks/PivotFunctions-Introduction.ipynb) This is a quick introduction that covers concepts and most of the use cases for pivot functions
[PivotFunctions](https://github.com/microsoft/msticpy/blob/main/docs/notebooks/PivotFunctions.ipynb) This follows the content of this document more closely with more detailed examples and explanations.
Changes in V2.0.0
MSTICPy v2.0.0 introduced some changes into pivot functions. The main ones are:
No need to manually initialize the Pivot library - this is done for you in
init_notebookfunction.Better support for data queries from multiple data query providers
Support for multiple instances of query providers (e.g. multiple MS Sentinel workspaces, multiple Sumologic instances)
TI pivot functions have been simplified by removing provider-specific lookup functions. You can use the optional
providersparameter to specify a subset list of available provider names (the default is to query all configured providers.)Prefixes to some of the query pivot functions have changed.
Additional pivot functions added for MS Defender queries.
Data query pivot functions are added dynamically as you connect to new data providers. This means that no data query functions will appear attached to entities until you call
connectto authenticate to the data service.
What is “Pivoting”?
The term comes from the common practice of Cyber investigators navigating between related entities. For example an entity/investigation chain might look like the following:
Step |
Source |
Operation |
Target |
|---|---|---|---|
1 |
Alert |
Review alert -> |
Source IPs |
2 |
Source IPs |
Lookup TI -> |
Related URLs and Malware names |
3 |
URL |
Query web logs -> |
Requesting hosts |
4 |
Host |
Query host logons -> |
Accounts |
At each step there are one or more directions that you can take to follow the chain of related indicators of activity (IoAs) in a possible attack.
Bringing these functions into a few, well-known locations makes it easier to use MSTICPy to carry out this common pivoting pattern in Jupyter notebooks.
Getting started
The pivoting library depends on a number of data providers and other
functions defined in
MSTICPy. These are loaded and initialized automatically by the
pivot system during init_notebook. Data query pivots are added
as you create and initialize QueryProvider objects.
import msticpy as mp
mp.init_notebook();
On successful initialization, the pivot subsystem is loaded
and is accessible via the pivot attribute of msticpy.
What happens at initialization?
The TILookup provider is loaded and entity-specific lookups (e.g. IP, Url, File) are added as pivot functions
MSTICPy functions and classes (e.g. GeoIP, IpType, Domain utils) are added as pivot functions to the appropriate entity.
A default time range is set - this is only used by queries executed as pivot functions and is covered later in Data query pivot functions
You can add your own or third party functions as pivot functions by creating a registration template and importing the function. Details of this are covered later in Customizing and managing Pivots.
View the list of providers loaded by the Pivot class
Notice that TILookup was loaded even though we did not create an instance of TILookup beforehand.
mp.providers
{'TILookup': <msticpy.context.tilookup.TILookup at 0x2741e114888>}
Creating and connecting a QueryProvider will add this to the
providers list.
qry_prov = mp.QueryProvider("MSSentinel")
qry_prov.connect(workspace="Default")

mp.providers
{'MSSentinel': <msticpy.data.core.data_providers.QueryProvider at 0x1c163725e50>,
 'TILookup': <msticpy.context.tilookup.TILookup at 0x2741e114888>}
After initialization, entities have pivot functions added to them
print("Host pivot functions\n")
display(entities.Host.pivots())
print("\nIpAddress pivot functions\n")
display(entities.IpAddress.pivots())
Host pivot functions

['MSSentinel.VMComputer_vmcomputer',
'MSSentinel.alerts',
'MSSentinel.aznet_interface',
'MSSentinel.aznet_net_flows',
'MSSentinel.aznet_net_flows_depr',
'MSSentinel.azsent_bookmarks',
'MSSentinel.hb_heartbeat',

...
'MSSentinel.wevt_logons',
'MSSentinel.wevt_parent_process',
'MSSentinel.wevt_process_session',
'MSSentinel.wevt_processes',
'RiskIQ.articles',
'RiskIQ.artifacts',
...
'dns_is_resolvable',
'dns_resolve',
'util.dns_components',
'util.dns_in_abuse_list',
'util.dns_is_resolvable',
'util.dns_resolve',
'util.dns_validate_tld']

IpAddress pivot functions

['MSSentinel.hb_heartbeat',
...
'geoloc',
'ip_type',
'ti.lookup_ip',
'tilookup_ip',
'util.geoloc',
'util.geoloc_ips',
'util.ip_rev_resolve',
'util.ip_type',
'util.whois',
'whois']
Discovering entity names
The entities module has a utility names find_entity. You
can use that to verify the name of an entity.
entities.find_entity("dns")
Match found 'Dns'

msticpy.datamodel.entities.dns.Dns
If a unique match is found the entity class is returned. Otherwise, we try to suggest possible matches for the entity name.
entities.find_entity("azure")
No exact match found for 'azure'.
Closest matches are 'AzureResource', 'Url', 'Malware'
Pivot functions are grouped into containers
Data queries are grouped into a container with the name of the data provider to which they belong. E.g. MSSentinel queries are in a container of that name, Splunk queries would be in a “Splunk” container.
TI lookups are put into a “ti” container.
All other built-in functions are added to the “util” container.
The containers themselves are callable and will return a list of their contents.
entities.Host.MSSentinel()
list_related_alerts function
az_net_analytics function
get_info_by_hostname function
auditd_all function
...
Containers are also iterable - each iteration returns a tuple (pair) of name/function values.
[query for query, _ in entities.Host.MSSentinel if "logon" in query]
['user_logon',
 'list_logons_for_host',
 'list_host_logon_failures',
 'get_host_logon',
 'list_host_logons',
 'list_all_logons_by_host']
In notebooks/IPython and some code editors you can use tab completion or “intellisense” to get to the right pivot function.
Shortcut pivot functions
A subset of many regularly-used pivot functions are also added as “shortcuts” to the entities. These are not in containers but available as direct methods on the entity classes and entity instances. A shortcut is just a reference or pointer to a pivot function in one of the containers described in the previous section.
Because the shortcut methods behave as instance methods they can take input
values from the entity attributes directly. In this example, the input to
the ip_type function is automatically taken from the Address
attribute of the IP entity.
>>> ip = IpAddress(Address="192.168.1.1")
>>> ip.ip_type()
ip          result
192.168.1.1 Private
These shortcuts otherwise work in the same way as the pivot functions
described in the rest of the document. In the previous example showing
pivot functions with the pivots() function, the shortcut
versions of the pivot functions appear without a “.” in the name.
You can create your own shortcut methods to existing or custom pivot functions as described in ../extending/PivotFunctions:Creating and deleting shortcut pivot functions.
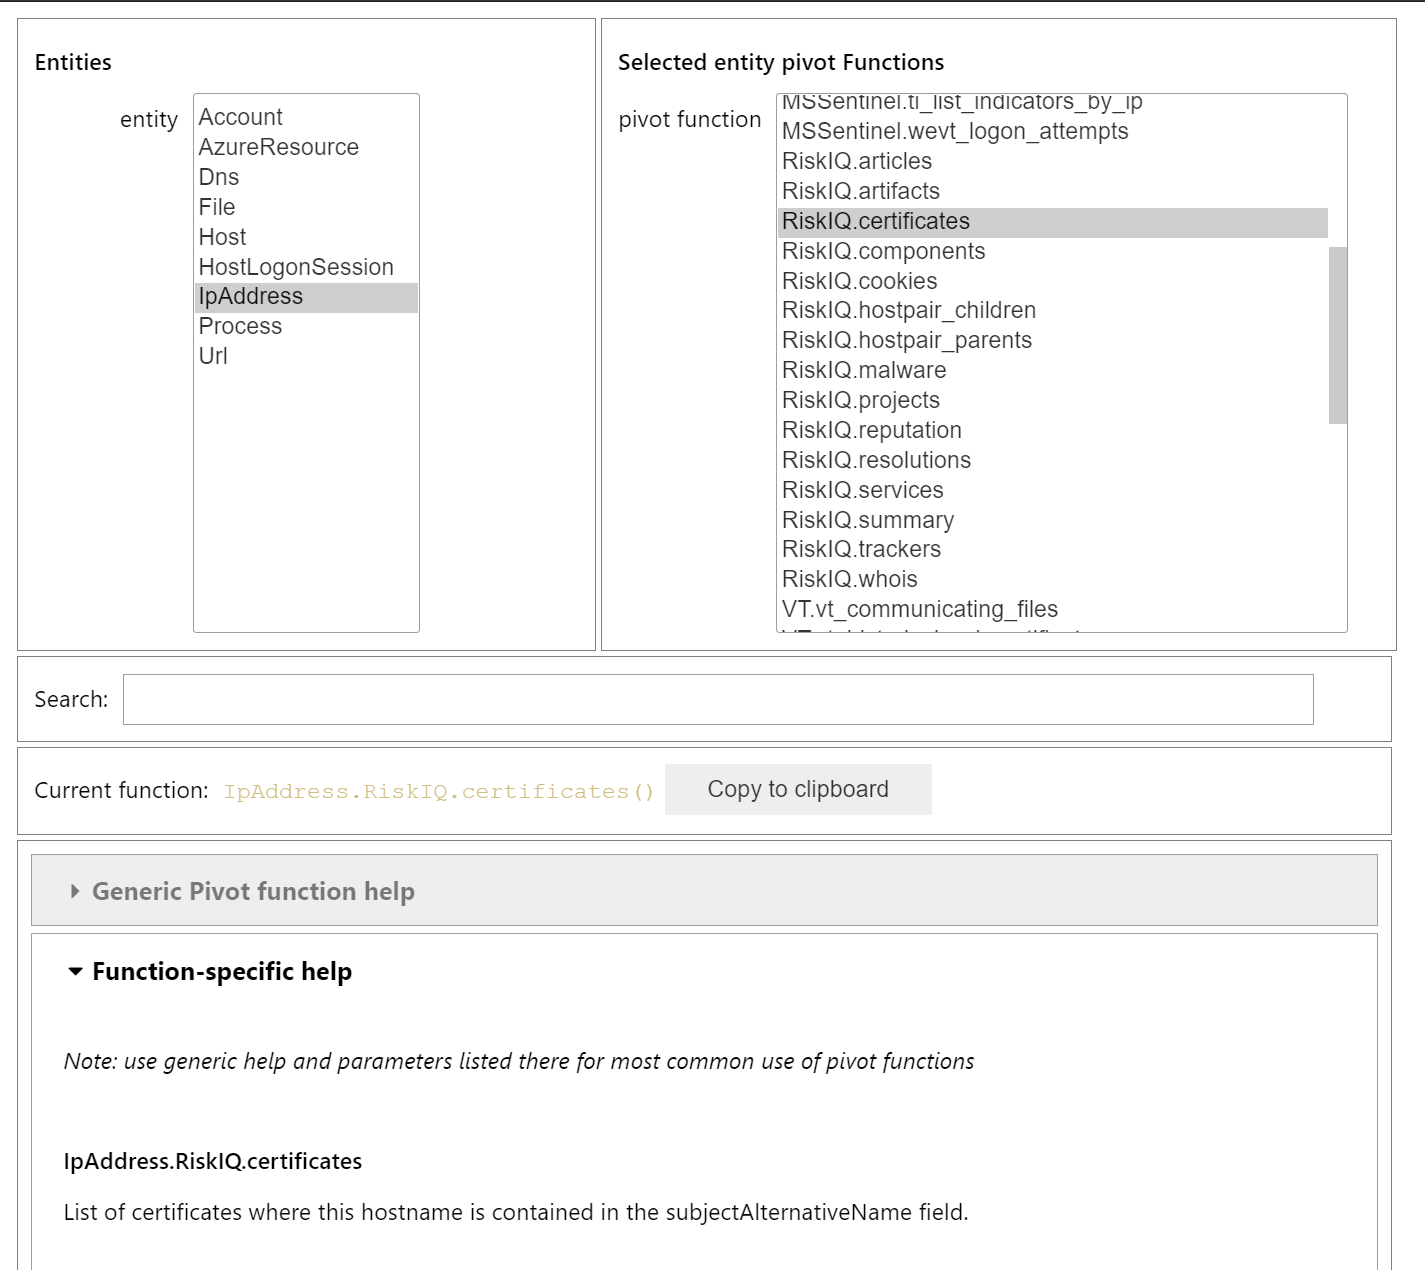
Using the Pivot Browser
Pivot also has a utility that allows you to browse entities and the pivot functions attached to them. You can search for functions with desired keywords, view help for the specific function and copy the function signature to paste into a code cell. Both fully-qualified pivot functions and shortcut equivalents are shown in the browser.
Pivot.browse()
Running a pivot function
Pivot functions require some kind of entity identifier (e.g. account name, IP address) as input. These can be passed to a pivot function in a variety of formats:
entity instances (e.g. where you have a MSTICPy IpAddress entity with a populated
Addressfield)single values (e.g. a string with DNS domain name)
lists of values (e.g. a list of IpAddresses)
pandas DataFrames (where one or more of the columns contains the input parameter data that you want to use)
Pivot functions normally return results as a DataFrame - even if the result is a single row and column.
Note
A few complex functions such as Notebooklets can return composite result objects containing multiple DataFrames and other object types.
Pivot functions retain the documentation string of the function before it was wrapped so you can lookup help on a pivot function at any time using the builtin Python help() function or a trailing “?”
IpAddress.util.ip_type?
Signature: IpAddress.util.ip_type(ip: str = None, ip_str: str = None)
Docstring:
Validate value is an IP address and determine IPType category.

(IPAddress category is e.g. Private/Public/Multicast).

Parameters
----------
ip_str : str
    The string of the IP Address

Returns
-------
str
    Returns ip type string using ip address module
Specifying Parameter names
There are a few variations in the way you can specify parameters:
Positional parameter - If the function only accepts one parameter you can usually just supply it without a name - as a positional parameter (see first and third examples in the code sample in the next section)
Native parameter name - You can also use the native parameter name - i.e. a parameter name that the underlying (pivot-wrapped) function expects and that will be shown in the
help(function)output. (see the second example below)Generic parameter name - You can also use the generic parameter name “value” in most cases. (fourth example)
Note
There are some exceptions to the use of generic parameters like “column” and “value”. These are called out later in this document.
If in doubt, use help(entity.container.func) or entity.container.func?
to find the specific parameter(s) that the function expects.
Note
Most of the examples in the following sections use the IpAddress entity to it easier to compare the different ways of calling pivot functions. The same patterns apply to all other entities (Account, Host, Dns, Url, etc.) that have pivot functions.
Using single value parameters as input
Some examples of simple pivot functions for an IpAddress string.
display(IpAddress.util.ip_type("10.1.1.1"))
display(IpAddress.util.ip_type(ip_str="157.53.1.1"))
display(IpAddress.util.whois("157.53.1.1"))
display(IpAddress.util.geoloc(value="157.53.1.1"))
ip |
result |
|---|---|
10.1.1.1 |
Private |
ip |
result |
|---|---|
157.53.1.1 |
Public |
ip_column |
AsnDescription |
whois_result |
|---|---|---|
157.53.1.1 |
NA |
{‘nir’: None, ‘asn_registry’: ‘arin’, ‘asn’: ‘NA’, ‘asn_cidr’: ‘NA’, ‘asn_country_code’: ‘US’, ‘asn_date’: ‘2015-04-01’, ‘asn_description’: ‘NA’, ‘query’: ‘157.53.1.1’, ‘nets’: [{‘cidr’: ‘157.53.0.0/16’, ‘name’: ‘NETACTUATE-MDN-04’, ‘handle’: ‘NET-157-53-0-0-1’, ‘range’: ‘157.53.0.0 - 157.53.255.255’, ‘description’: ‘NetActuate, Inc’, ‘country’: ‘US’, ‘state’: ‘NC’, ‘city’: ‘Raleigh’, ‘address’: ‘PO Box 10713’, ‘postal_code’: ‘27605’, ‘emails’: [‘ops@netactuate.com’, ‘abuse@netactuate.com’], ‘created’: ‘2015-04-01’, ‘updated’: ‘2016-10-25’}], ‘raw’: None, ‘referral’: None, ‘raw_referral’: None} |
CountryCode |
CountryName |
State |
City |
Longitude |
Latitude |
Asn |
edges |
Type |
AdditionalData |
IpAddress |
|---|---|---|---|---|---|---|---|---|---|---|
US |
United States |
-97.822 |
37.751 |
set() |
geolocation |
{} |
157.53.1.1 |
Using an entity as a parameter
Behind the scenes, the Pivot API uses a mapping of entity attributes to supply the right input value to the function parameter. This is not always foolproof but usually works.
Here, we’re
creating two IpAddress entities and initializing their Address
attributes. Then we supply these entities as parameters to the pivot functions.
ip1 = IpAddress(Address="10.1.1.1")
ip2 = IpAddress(Address="157.53.1.1")

display(IpAddress.util.ip_type(ip1))
display(IpAddress.util.ip_type(ip2))
display(IpAddress.util.whois(ip2))
display(IpAddress.util.geoloc(ip2))
The output is the same as the previous example Using single value parameters as input
For shortcut functions you can also use the entity instance to provide the input value:
ip_1 = IpAddress(Address="10.1.1.1")
ip_2 = IpAddress(Address="157.53.1.1")
display(ip_1.ip_type())
display(ip_2.whois())
ip |
result |
|---|---|
10.1.1.1 |
Private |
ip_column |
AsnDescription |
whois_result |
|---|---|---|
157.53.1.1 |
NA |
{‘nir’: None, ‘asn_registry’: ‘arin’, ‘asn’: ‘NA’, ‘asn_cidr’: ‘NA’, ‘asn_country_code’: ‘US’, ‘asn_date’: ‘2015-04-01’, ‘asn_description’: ‘NA’, ‘query’: ‘157.53.1.1’, ‘nets’: [{‘cidr’: ‘157.53.0.0/16’, ‘name’: ‘NETACTUATE-MDN-04’, ‘handle’: ‘NET-157-53-0-0-1’, ‘range’: ‘157.53.0.0 - 157.53.255.255’, ‘description’: ‘NetActuate, Inc’, ‘country’: ‘US’, ‘state’: ‘NC’, ‘city’: ‘Raleigh’, ‘address’: ‘PO Box 10713’, ‘postal_code’: ‘27605’, ‘emails’: [‘ops@netactuate.com’, ‘abuse@netactuate.com’], ‘created’: ‘2015-04-01’, ‘updated’: ‘2016-10-25’}], ‘raw’: None, ‘referral’: None, ‘raw_referral’: None} |
Using a list (or other iterable) as a parameter
Most MSTICPy functions (the functions wrapped by the Pivot library) accept either single values or collections of values (usually in DataFrames) as input.
Using input functions that expect a single input value when you have a list of values to process can be messy. Functions that require DataFrame input can also take a bit of preparation time if the data you want to use isn’t already in a DataFrame. In either case you usually need to build some glue code to handle the formatting and calling the function multiple times.
The pivot library tries to smooth this path, so that you do not have to worry about how the original function was built to handle input. In cases where the underlying function does not accept iterables as parameters, the Pivot library will iterate through each value in your input list, calling the function and collating the results to hand you back a single DataFrame.
Note
Not all MSTICPy pivot functions will to allow iterated calling. This is usually where the underlying function is long-running or expensive and we’ve opted to block accepting iterated calls. Notebooklet pivots are examples of functions that will not work with iterable or DataFrame input.
Similarly, where the original (pivot-wrapped) function expects a DataFrame or iterable as an input, you can supply a simple string value to the pivot version, and the pivot interface will convert to input type that the function expects. For example, a single value passed to the pivot function will be converted to a single-column, single-row DataFrame, which is passed to the original function.
For functions with multiple input parameters, you can supply a mixture of iterables and single values. In these cases, the single-valued parameters are re-used on each call, paired with the item in the list(s) taken from the multi-valued parameters.
You can also use multiple iterables for multiple parameters. In this case the iterables should be the same length. If they are different lengths the iterations stop after the shortest list/iterable is exhausted.
For example:
list_1 = [1, 2, 3, 4]
list_2 = ["a", "b", "c"]
entity.util.func(p1=list_1, p2=list_2)
The function will execute with the pairings (1, “a”), (2, “b”) and (3, “c). The combination (4, _) will be ignored.
That may all sound a little confusing but, in practice, you should not need to worry about the mechanics of how the pivot library works.
This is an example of using the same pivot functions shown previously, but now with list inputs.
ip_list1 = ip_df1.AllExtIPs.values[-6:]

display(IpAddress.util.ip_type(ip_list1))
display(IpAddress.util.ip_type(ip_str=list(ip_list1)))
display(IpAddress.util.whois(value=tuple(ip_list1)))
display(IpAddress.util.geoloc(ip_list1))
ip |
result |
|---|---|
23.96.64.84 |
Public |
65.55.44.108 |
Public |
131.107.147.209 |
Public |
10.0.3.4 |
Private |
10.0.3.5 |
Private |
ip |
result |
|---|---|
23.96.64.84 |
Public |
65.55.44.108 |
Public |
131.107.147.209 |
Public |
10.0.3.4 |
Private |
10.0.3.5 |
Private |
nir |
asn_registry |
asn |
asn_cidr |
asn_country_code |
asn_date |
asn_description |
query |
nets |
raw |
referral |
raw_referral |
|---|---|---|---|---|---|---|---|---|---|---|---|
nan |
arin |
8075 |
23.96.0.0/14 |
US |
2013-06-18 |
MICROSOFT-CORP-MSN-AS-BLOCK, US |
23.96.64.84 |
[{‘cidr’: ‘23.96.0.0/13’, ‘name’: ‘MSFT’, ‘handle’: ‘NET-23-96-0-0-1’, ‘range’: ‘23.96.0.0 - 23.103.255.255’, ‘description’: ‘Microsoft Corporation’, ‘country’: ‘US’, ‘state’: ‘WA’, ‘city’: ‘Redmond’, ‘address’: ‘One Microsoft Way’, ‘postal_code’: ‘98052’, ‘emails’: [‘msndcc@microsoft.com’, ‘IOC@microsoft.com’, ‘abuse@microsoft.com’], ‘created’: ‘2013-06-18’, ‘updated’: ‘2013-06-18’}] |
nan |
nan |
nan |
nan |
arin |
8075 |
65.52.0.0/14 |
US |
2001-02-14 |
MICROSOFT-CORP-MSN-AS-BLOCK, US |
65.55.44.108 |
[{‘cidr’: ‘65.52.0.0/14’, ‘name’: ‘MICROSOFT-1BLK’, ‘handle’: ‘NET-65-52-0-0-1’, ‘range’: ‘65.52.0.0 - 65.55.255.255’, ‘description’: ‘Microsoft Corporation’, ‘country’: ‘US’, ‘state’: ‘WA’, ‘city’: ‘Redmond’, ‘address’: ‘One Microsoft Way’, ‘postal_code’: ‘98052’, ‘emails’: [‘msndcc@microsoft.com’, ‘IOC@microsoft.com’, ‘abuse@microsoft.com’], ‘created’: ‘2001-02-14’, ‘updated’: ‘2013-08-20’}] |
nan |
nan |
nan |
nan |
arin |
3598 |
131.107.0.0/16 |
US |
1988-11-11 |
MICROSOFT-CORP-AS, US |
131.107.147.209 |
[{‘cidr’: ‘131.107.0.0/16’, ‘name’: ‘MICROSOFT’, ‘handle’: ‘NET-131-107-0-0-1’, ‘range’: ‘131.107.0.0 - 131.107.255.255’, ‘description’: ‘Microsoft Corporation’, ‘country’: ‘US’, ‘state’: ‘WA’, ‘city’: ‘Redmond’, ‘address’: ‘One Microsoft Way’, ‘postal_code’: ‘98052’, ‘emails’: [‘msndcc@microsoft.com’, ‘IOC@microsoft.com’, ‘abuse@microsoft.com’], ‘created’: ‘1988-11-11’, ‘updated’: ‘2013-08-20’}] |
nan |
nan |
nan |
nan |
nan |
nan |
nan |
nan |
nan |
nan |
nan |
nan |
nan |
nan |
nan |
nan |
nan |
nan |
nan |
nan |
nan |
nan |
nan |
nan |
nan |
nan |
nan |
CountryCode |
CountryName |
State |
City |
Longitude |
Latitude |
Asn |
edges |
Type |
AdditionalData |
IpAddress |
|---|---|---|---|---|---|---|---|---|---|---|
US |
United States |
Virginia |
Washington |
-78.1539 |
38.7095 |
set() |
geolocation |
{} |
23.96.64.84 |
|
US |
United States |
Virginia |
Boydton |
-78.375 |
36.6534 |
set() |
geolocation |
{} |
65.55.44.108 |
|
US |
United States |
Washington |
Redmond |
-122.126 |
47.6722 |
set() |
geolocation |
{} |
131.107.147.209 |
|
US |
United States |
Virginia |
Washington |
-78.1539 |
38.7095 |
set() |
geolocation |
{} |
13.82.152.48 |
Using DataFrames as input
Using a DataFrame as input requires a slightly different syntax since you not only need to pass the DataFrame as a parameter but also tell the function which DataFrame column to use for input.
To specify the column to use, you can use the name of the parameter that
the underlying function expects. E.g. if the original function expected
the parameter src_ip to be passed with the value of an IP address,
you would use the syntax:
IpAddress.ip_type(data=my_df, src_ip="SrcIPColumnName")
You can also or one of these generic names to specify the column name:
column
input_column
input_col
src_column
src_col
Note
These generic names are not shown in the function help: they are just a convenience so that you don’t need to remember what the names of the underlying function parameters are.
Examples showing the same pivot functions with DataFrame inputs.
display(IpAddress.util.ip_type(data=ip_df1, input_col="AllExtIPs"))
display(IpAddress.util.ip_type(data=ip_df1, ip="AllExtIPs"))
display(IpAddress.util.whois(data=ip_df1, column="AllExtIPs"))
display(IpAddress.util.geoloc(data=ip_df1, src_col="AllExtIPs"))
Output is the same as Using a list (or other iterable) as a parameter
Aside - converting text to a DataFrame
MSTICPy includes a convenience IPython magic - txt2df that lets
you convert raw, structured text (e.g. something pasted from a Threat
Intel report) into a DataFrame.
The txt2df magic is imported and loaded into the notebook by the
init_notebook function.
In the following example, we paste in the text into a cell,
add the cell magic %%txt2df
at the top of the cell with parameters.
The parameters tell it that the first row is a header row and that we want it to
create a named pandas DataFrame in the notebook global namespace.
(This means that when you execute this cell it will create
a DataFrame variable named “ip_df1” that you can use in subsequent
cells).
Use %%txt2df --help to see the supported usage.
%%txt2df --headers --name ip_df1
AllExtIPs
9, 172.217.15.99
10, 40.85.232.64
11, 20.38.98.100
12, 23.96.64.84
13, 65.55.44.108
9 |
172.217.15.99 |
10 |
40.85.232.64 |
11 |
20.38.98.100 |
12 |
23.96.64.84 |
13 |
65.55.44.108 |
Joining input to output data
You might want to return a data set that is joined to your input set. To do that use the “join” parameter. Join works with all types of inputs: value, list or DataFrame.
The value of join can be one of the following:
inner
left
right
outer
To preserve all rows from the input, use a “left” join. To keep only rows that have a valid result from the function use “inner” or “right”
Note while most functions only return a single output row for each input row, some return multiple rows. Be cautious using “outer” in these cases.
display(IpAddress.util.geoloc(data=ip_df1, src_col="AllExtIPs", join="left"))
AllExtIPs |
CountryCode |
CountryName |
State |
City |
Longitude |
Latitude |
Asn |
edges |
Type |
AdditionalData |
IpAddress |
|---|---|---|---|---|---|---|---|---|---|---|---|
172.217.15.99 |
US |
United States |
-97.822 |
37.751 |
set() |
geolocation |
{} |
172.217.15.99 |
|||
40.85.232.64 |
CA |
Canada |
Ontario |
Toronto |
-79.4195 |
43.6644 |
set() |
geolocation |
{} |
40.85.232.64 |
|
20.38.98.100 |
US |
United States |
Virginia |
Washington |
-78.1539 |
38.7095 |
set() |
geolocation |
{} |
20.38.98.100 |
|
23.96.64.84 |
US |
United States |
Virginia |
Washington |
-78.1539 |
38.7095 |
set() |
geolocation |
{} |
23.96.64.84 |
|
65.55.44.108 |
US |
United States |
Virginia |
Boydton |
-78.375 |
36.6534 |
set() |
geolocation |
{} |
65.55.44.108 |
By default, the pivot functions will infer the join keys for input and output data from the function definitions and parameters.
For advanced use, you can override the default behavior of joining on
inferred join keys by specifying left_on and right_on parameters.
The left_on parameter is typically the input parameter name and
right_on is a column in the output DataFrame (the pivot results).
Usually, you won’t need to use this flexibility.
The join operation also supports a join_ignore_case parameter.
This lets you join text columns ignoring case differences. This can
be helpful with data like hash strings and domain names, which are
case insensitive and can be represented differently.
Warning
using join_ignore_case does add a performance
overhead since normalized case columns need to be created for both
input and output data sets before the join takes place.
This might be a significant overhead on larger data sets.
Data query pivot functions
Many of the MSTICPy built-in queries are exposed as
pivot functions. Queries are attached to the entities
that they are directly relevant to. For example, list_host_logons
is a method of the Host entity.
How are queries assigned to specific entities?
The Pivot library uses the parameters defined for each query to decide whether a query is related to a particular entity type. It also uses the query parameters to create mappings between specific entity attributes (e.g. IpAddress.Address) and query parameters (ip_address or ip_address_list).
It uses a limited set of parameter names to do this mapping so to have your query show up as a pivot function, you should follow the same standard parameter naming as we use in MSTICPy built-in queries.
Query parameter mapping:
Query Parameter |
Entity |
Entity Attribute |
|---|---|---|
account_name |
Account |
Name |
host_name |
Host |
fqdn |
process_name |
Process |
ProcessFilePath |
source_ip_list |
IpAddress |
Address |
ip_address_list |
IpAddress |
Address |
ip_address |
IpAddress |
Address |
user |
Account |
Name |
logon_session_id |
Process HostLogonSession Account |
LogonSession SessionId LogonId |
process_id |
Process |
ProcessId |
commandline |
Process |
CommandLine |
url |
Url |
Url |
file_hash |
File |
file_hash |
domain |
Dns |
DomainName |
resource_id |
AzureResource |
ResourceId |
If you have existing queries that use different names than those listed in this table, you can take advantage of a feature added to the MSTICPy query definition format - parameter aliases.
To use these, change the primary name of your parameter to one of the items listed above and then add an aliases item to the parameter entry for the query. The example below shows that file_hash has an alias of sha1. This means that you can use either of these names to refer to the same parameter when invoking the query.
Running pivot data queries
Data query parameter names
A significant difference between the pivot functions that we’ve seen so far
and data query functions is that the latter do not accept generic
parameter names (other than the data parameter).
The reason for this is that, frequently, data queries require multiple parameters and using generic names like “column” and “value” makes it very difficult to decide which value belongs to which column.
When you use a parameter in a data query pivot, you must specify the parameter name that the query function is expecting.
Host.MSSentinel.list_host_events_by_id(
    host_name="mypc",
)

Host.MSSentinel.list_host_events_by_id(
    data=input_df,
    host_name="computer",
)
In the first example, the query will be run with “host_name=’mypc’.
In the second example, we’re using a DataFrame as input and supply
the DataFrame as the data parameter.
The query (list_host_events_by_id) expects host_name as a parameter.
The value of this parameter is the name of the DataFrame column
that contains the host names that we want to use. The query will
be executed once for each row of the input DataFrame,
supplying value for the
computer column in each row as the query’s host_name parameter.
If in doubt about what the correct parameter name to use is, use the “?” suffix to show the function help.
Example:
Host.AzureSentinel.list_host_events_by_id?
Ensure that you’ve authenticated/connected to the data provider.
ws = WorkspaceConfig(workspace="YourWorkspace")
az_provider.connect(ws.code_connect_str)
Data Query Time ranges
A second significant difference from other pivot functions is that most queries require a time range to operate over.
The start and end datetime parameters common to most queries
are automatically added by the pivot library. The values of these are
taken from the Pivot subsystem, using the time range
defined in its timespan property. You can override these auto-populated
values when you call a pivot query function by explicitly
specifying the start and end parameter values in the function
call.
Note
The pivot time range is used dynamically. If you change the Pivot timespan property, the new value will be used by future queries as they are run. This means that if you re-run earlier queries after changing the timespan they will execute with different time parameters.
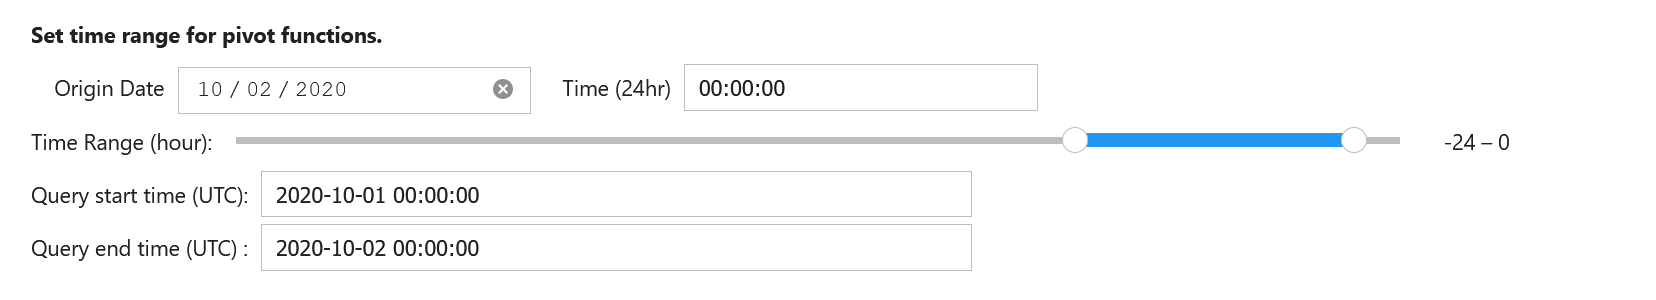
Setting default timespan for queries interactively
Use the edit_query_time function to set/change the time range used
by pivot queries.
With no parameters it displays (and allows you to change) the current time range. This time range defaults to:
start == [UtcNow - 1 day]
end == [UtcNow]
where UtcNow is the time when MSTICPy was initialized.
You can specify a different timespan for the QueryTime UI, using
the TimeSpan class.
This will change the pivot internal time range and display
the QueryTime editor, where you can tweak the time range.
See edit_query_time
from msticpy.common.timespan import TimeSpan
ts = TimeSpan(start="2020-10-01", period="1d")
mp.pivot.edit_query_time(timespan=ts)
Setting the timespan programmatically
You can also just set the
timespan
attribute directly on the pivot object
mp.pivot.timespan = ts
Resetting the TimeSpan
You can reset the time range to the default of the previous
24 hours with reset_timespan.
Note
This will reset the time range using now at the
time you call reset_timespan. This will, of course, be
a different “now” to the one used by MSTICPy when it first
initialized.
What data queries do we have?
This will vary for each Entity type (many entity types have no data queries).
For each entity type, you can call the container object corresponding to the data provider that you want to view.
Host.MSSentinel()
auditd_auditd_all function
az_nsg_interface function
az_nsg_net_flows function
az_nsg_net_flows_depr function
heartbeat function
heartbeat_for_host_depr function
sec_alerts function
sent_bookmarks function
syslog_all_syslog function
syslog_cron_activity function
syslog_sudo_activity function
syslog_user_group_activity function
VMComputer_vmcomputer function
...
host = Host(HostName="VictimPc")
Host.MSSentinel.hb_heartbeat(host)
SourceSystem |
TimeGenerated |
ComputerIP |
Computer |
Category |
OSType |
OSMajorVersion |
OSMinorVersion |
Version |
|---|---|---|---|---|---|---|---|---|
OpsManager |
2020-12-02 20:24:59.613000+00:00 |
13.89.108.248 |
VictimPc.Contoso.Azure |
Direct Agent |
Windows |
10 |
0 |
10.20.18040.0 |
Note
some columns have been removed for brevity
Host.MSSentinel.wevt_logons(host_name="VictimPc").head()
Account |
EventID |
TimeGenerated |
Computer |
SubjectUserName |
SubjectDomainName |
SubjectUserSid |
TargetUserName |
TargetDomainName |
TargetUserSid |
TargetLogonId |
|---|---|---|---|---|---|---|---|---|---|---|
NT AUTHORITYSYSTEM |
4624 |
2020-10-01 22:39:36.987000+00:00 |
VictimPc.Contoso.Azure |
VictimPc$ |
CONTOSO |
S-1-5-18 |
SYSTEM |
NT AUTHORITY |
S-1-5-18 |
0x3e7 |
NT AUTHORITYSYSTEM |
4624 |
2020-10-01 22:39:37.220000+00:00 |
VictimPc.Contoso.Azure |
VictimPc$ |
CONTOSO |
S-1-5-18 |
SYSTEM |
NT AUTHORITY |
S-1-5-18 |
0x3e7 |
NT AUTHORITYSYSTEM |
4624 |
2020-10-01 22:39:42.603000+00:00 |
VictimPc.Contoso.Azure |
VictimPc$ |
CONTOSO |
S-1-5-18 |
SYSTEM |
NT AUTHORITY |
S-1-5-18 |
0x3e7 |
CONTOSORonHD |
4624 |
2020-10-01 22:40:00.957000+00:00 |
VictimPc.Contoso.Azure |
VictimPc$ |
CONTOSO |
S-1-5-18 |
RonHD |
CONTOSO |
S-1-5-21-1661583231-2311428937-3957907789-1105 |
0x117a0f7f |
NT AUTHORITYSYSTEM |
4624 |
2020-10-01 22:40:14.040000+00:00 |
VictimPc.Contoso.Azure |
VictimPc$ |
CONTOSO |
S-1-5-18 |
SYSTEM |
NT AUTHORITY |
S-1-5-18 |
0x3e7 |
Query container names
As we saw in earlier examples, queries are grouped into containers. The containers have the name of the query provider (e.g. “MSentinel”, “Splunk”, “MDE”, etc.). In some cases, query providers support multiple instances (e.g. MS Sentinel workspaces). If you have authenticated to multiple instances of a provider, a suffix with the name of the instance is added. In the case of MS Sentinel, connecting to your “Default” workspace will create a container name without a suffix. Subsequent workspaces will be have the workspace name suffix.
qry_prov2 = QueryProvider("MSSentinel")
qry_prov2.connect(workspace="CyberSecuritySOC")

Host.pivots()
['MSSentinel_cybersecuritysoc.VMComputer_vmcomputer',
'MSSentinel_cybersecuritysoc.auditd_auditd_all',
'MSSentinel_cybersecuritysoc.az_nsg_interface',
'MSSentinel_cybersecuritysoc.az_nsg_net_flows',
'MSSentinel_cybersecuritysoc.az_nsg_net_flows_depr',
...
Query names and prefixes
The queries are usually prefixed by a short string indicating the data table (or data source) targeted by the query. This is to help disambiguate the query functions and keep the overall function name manageably short.
Some commonly used prefixes are:
Prefix |
Data source |
|---|---|
sent |
Azure Sentinel data queries (e.g. bookmarks) |
az_nsg |
Azure network analytics |
aad |
Azure Active Directory |
az |
Other Azure |
hb |
OMS Heartbeat table |
syslog |
Linux Syslog |
auditd |
Linux auditd |
o365 |
Office 365 activity |
wevt |
Windows security events |
The built-in queries have a property called “DataFamily” that is used to group related queries (e.g. “WindowsSecurity”, “Syslog”, “Azure”). This is not used by the pivot query functions. If you prefer to use the DataFamily as the query prefix you can add a setting to your msticpyconfig.yaml:
Pivots:
    UseQueryFamily: true
Many queries use shortened names to reduce length and redundant information. For example:
QueryProvider name |
Pivot name |
|---|---|
WindowsSecurity.list_host_logons |
Host.MSSentinel.wevt_logons |
WindowsSecurity.list_logons_by_account |
Account.MSSentinel.wevt_logons |
WindowsSecurity.list_logon_failures_by_account |
Account.MSSentinel.wevt_logon_failures |
AzureNetwork.list_azure_network_flows_by_ip |
IpAddress.MSSentinel.az_nsg_net_flows |
Using additional query parameters
You may need to specify multiple parameters for a query. For example,
the list_host_events_by_id function requires a host_name parameter
but can also take a list of event IDs to filter the list returned.
Retrieves list of events on a host.

Parameters
----------
add_query_items: str (optional)
    Additional query clauses
end: datetime
    Query end time
event_list: list (optional)
    List of event IDs to match
    (default value is: has)
host_name: str
    Name of host
The example below shows using two parameters - an entity and a list.
The host entity is the initial positional parameter.
Pivot is using the attribute mapping to assign the host_name function
parameter the value of the host.fqdn entity attribute.
The second parameter is a list of event IDs.
Also notice that we are following the query with a series of pandas expressions. Because the return value of these functions is a pandas DataFrame you can perform pandas operations on the data before displaying it or saving to a variable.
The pandas code here simply selects a subset of columns, the groups by EventID to return a count of each event type.
(
    Host.MSSentinel.wevt_events_by_id(      # Pivot query returns DataFrame
        host, event_list=[4624, 4625, 4672]
    )
    [["Computer", "EventID", "Activity"]]   # we could have saved the output to a dataframe
    .groupby(["EventID", "Activity"])       # variable but we can also use pandas
    .count()                                # functions/syntax directly on the DF output
)
(4624, ‘4624 - An account was successfully logged on.’) |
520 |
(4672, ‘4672 - Special privileges assigned to new logon.’) |
436 |
Using the “print” parameter to help debug queries
When calling queries directly from the data provider (e.g.
my_provider.get_host_logons(...)) you can supply a positional string argument
“print”. This causes the query that would be sent to the provider to be
returned as a string, with parameter values substituted. This is useful for
debugging queries.
This isn’t possible using pivot versions of the query. Call the query directly from the QueryProvider to debug problems using “print”.
Using iterables as parameters to data queries
Some data queries accept “list” items as parameters (e.g. many of the IP queries accept a list of IP addresses). These work as expected, with a single query calling sending the whole list as a single parameter.
ip_list = [
    "203.23.68.64",
    "67.10.68.45",
    "182.69.173.164",
    "79.176.167.161",
    "167.220.197.230",
]

IpAddress.MSSentinel.list_aad_signins_for_ip(ip_address_list=ip_list).head(5)
TimeGenerated |
OperationName |
ResultType |
Identity |
Level |
Location |
AppDisplayName |
AuthenticationRequirement |
ClientAppUsed |
ConditionalAccessPolicies |
DeviceDetail |
IsInteractive |
UserPrincipalName |
Type |
|---|---|---|---|---|---|---|---|---|---|---|---|---|---|
2020-10-01 13:02:35.957000+00:00 |
Sign-in activity |
0 |
Brandon |
4 |
US |
Azure Advanced Threat Protection |
singleFactorAuthentication |
Browser |
[{‘id’: ‘8872f6fb-da88-4b6… |
{‘deviceId’: ‘’, ‘oper… |
False |
SigninLogs |
|
2020-10-01 14:02:40.100000+00:00 |
Sign-in activity |
0 |
Brandon |
4 |
US |
Azure Advanced Threat Protection |
singleFactorAuthentication |
Browser |
[{‘id’: ‘8872f6fb-da88-4b6… |
{‘deviceId’: ‘’, ‘oper… |
False |
SigninLogs |
|
2020-10-01 15:02:45.205000+00:00 |
Sign-in activity |
0 |
Brandon |
4 |
US |
Azure Advanced Threat Protection |
singleFactorAuthentication |
Browser |
[{‘id’: ‘8872f6fb-da88-4b6… |
{‘deviceId’: ‘’, ‘oper… |
False |
SigninLogs |
|
2020-10-01 17:45:14.507000+00:00 |
Sign-in activity |
0 |
Brandon |
4 |
US |
Microsoft Cloud App Security |
singleFactorAuthentication |
Browser |
[{‘id’: ‘8872f6fb-da88-4b6… |
{‘deviceId’: ‘’, ‘oper… |
False |
SigninLogs |
|
2020-10-01 10:02:18.923000+00:00 |
Sign-in activity |
0 |
Brandon |
4 |
US |
Azure Advanced Threat Protection |
singleFactorAuthentication |
Browser |
[{‘id’: ‘8872f6fb-da88-4b6… |
{‘deviceId’: ‘’, ‘oper… |
False |
SigninLogs |
Using iterable parameter values for queries that only accept single values
In this case the pivot function will iterate through the values of the iterable, making a separate query for each and then joining the results.
We can see that list_aad_signins_for_account only accepts a single value for
“account_name”.
Account.AzureSentinel.list_aad_signins_for_account?
Lists Azure AD Signins for Account

Parameters
----------
account_name: str
    The account name to find
add_query_items: str (optional)
    Additional query clauses
end: datetime (optional)
    Query end time
start: datetime (optional)
    Query start time
    (default value is: -5)
table: str (optional)
    Table name
    (default value is: SigninLogs)
We can pass a list of account names that we want to return results for, assigning
the list to the account_name parameter. The pivot library takes care of
executing the individual queries and joining the results.
accounts = [
    "ananders",
    "moester",
]

Account.MSSentinel.list_aad_signins_for_account(account_name=accounts)
TimeGenerated |
OperationName |
ResultType |
Identity |
Level |
Location |
AppDisplayName |
AuthenticationRequirement |
ClientAppUsed |
ConditionalAccessPolicies |
DeviceDetail |
IsInteractive |
UserAgent |
UserPrincipalName |
|---|---|---|---|---|---|---|---|---|---|---|---|---|---|
2020-10-01 11:04:42.689000+00:00 |
Sign-in activity |
0 |
Anil Anders |
4 |
IL |
Azure Portal |
multiFactorAuthentication |
Browser |
[{‘id’: ‘8872f6fb-da88-4b63-bcc7-17247669596b’, ‘disp |
{‘deviceId’: ‘’, ‘operatingSyste |
False |
Mozilla/5.0 (Windows NT 10… |
|
2020-10-01 11:19:36.626000+00:00 |
Sign-in activity |
0 |
Mor Ester |
4 |
IL |
Azure Portal |
multiFactorAuthentication |
Browser |
[{‘id’: ‘8872f6fb-da88-4b63-bcc7-17247669596b’, ‘disp |
{‘deviceId’: ‘e7e06bcd-1c72-4550 |
False |
Mozilla/5.0 (Windows NT 10… |
|
2020-10-01 11:19:40.787000+00:00 |
Sign-in activity |
0 |
Mor Ester |
4 |
IL |
Azure Portal |
singleFactorAuthentication |
Browser |
[{‘id’: ‘8872f6fb-da88-4b63-bcc7-17247669596b’, ‘disp |
{‘deviceId’: ‘e7e06bcd-1c72-4550 |
False |
Mozilla/5.0 (Windows NT 10… |
Of course, this type of iterated query execution is not as efficient as constructing the query to do exactly what you want and letting the database engine take care of the details. However, it does mean that we can use generic queries in a more flexible way than was possible before.
Warning
Because iterating queries like this is not very efficient, you should avoid using this for large queries where you are passing thousands of query values in a list or DataFrame.
Combining multiple iterables and single-valued parameters
The same rules as outline earlier for multiple parameters of different types apply to data queries.
Here we are combining sending a list and a string.
project = "| project UserPrincipalName, Identity"
Account.AzureSentinel.list_aad_signins_for_account(account_name=accounts, add_query_items=project)
Using DataFrames as input to query pivots
This is similar to using DataFrames as input parameters, as described earlier.
You must use the data parameter to specify the input DataFrame. You
supply the column name from your input DataFrame as the value of the
parameters expected by the function.
Let’s create a toy DataFrame from the earlier list to show the principle.
account_df = pd.DataFrame(accounts, columns=["User"])
display(account_df)
Now that we have our input DataFrame we can use it as a parameter to our pivot query function:
we specify
account_dfas the value of thedataparameter.in our source (input) DataFrame, the column that we want to use as the input value for each query is
Userwe specify that column name as the value of the function parameter. In this case the function parameter is
account_name.
On each iteration, the column value from the current row will be
extracted and given as the parameter value for the account_name
function parameter.
If the function query parameter type is a list type - i.e. it expects a list of values, the parameter value will be sent as a list created from all of the values in that DataFrame column. Similarly, if you have multiple list parameters sourced from different columns of your input DataFrame, a list will be created for column and assigned to the query parameter. In cases where you have only a single list parameter or all parameters are lists, only a single query is executed.
However, if you have multiple parameters of mixed types (i.e. some lists and some string parameters), the query will be broken into separate queries for each row of the input DataFrame. Each sub-query will get its parameter values from a single row of the input DataFrame.
You should not need to worry about these details but if a query operation is taking longer than expected, it might be useful to know what is happening under the covers.
Joining query output to input
If the input to your data query pivot function is a DataFrame you can also join it to the output. By default, it uses the index of the input rows to join to the output. This usually works well unless the input index has duplicate values.
Index joining may not work if the query parameter are “list” types
(e.g. some queries accept parameters that are a sequence of values).
In these cases, you can override the default joining behavior by
specifying left_on and right_on column names. The left_on
column name must be a column in the input DataFrame and right_on
must be a column in the output DataFrame (the query results).
The join operation also supports a join_ignore_case parameter.
This lets you join text columns ignoring case differences. This can
be helpful with data like hash strings and domain names, which are
case insensitive and can be represented differently.
Warning
using join_ignore_case does add a performance
overhead since normalized case columns need to be created from
the data before the join takes place. This might be noticable
on larger data sets.
Threat Intelligence lookups
These work in the same way as the functions described earlier. However, there are a few peculiarities of the Threat Intel functions:
Controlling which providers are used
In the earlier version of pivot functions, there were individual
functions for each provider, for example: lookup_ip_vt, lookup_ip_otx.
These have been removed to simplify things. By default, the single
TI lookup function for the entity will query all loaded providers
that support that observable type. If you want to specify which
providers to query you can use the providers parameter
to specify a list of provider names.
IPv4 and IPv6
Some TI providers treat these interchangeably and use the same endpoint for both. Other providers do not support IPV6, others (notably OTX) use different endpoints for IPv4 and IPv6.
In the previous version of pivots, there were separate ipv4 and ipv6 lookup functions. These have been removed in favor of a single “ip” function. The IP type will be dynamically determined at runtime (by regular expression match) and sent to appropriate provider endpoint. If a provider does not support a particular type an empty result for this row is returned.
Entity mapping to IoC Types
This table shows the mapping between and entity type and IoC Types:
Entity |
IoCType |
|---|---|
IpAddress |
ipv4, ipv6 |
Dns |
domain |
File |
filehash (including md5, sha1, sha256) |
Url |
url |
You will find all of the TI Lookup functions relating to IpAddresses as pivot functions attached to the IpAddress entity.
Note
Where you are using a File entity as a parameter -
i.e. an instance of the File class - there is a
complication. A file entity can have multiple hash values (md5, sha1,
sha256 and even sha256 Authenticode). The file_hash attribute of
File is used as the default parameter. In cases where a file has
multiple hashes, the highest priority hash (in order sha256, sha1,
md5, sha256ac) is used. If you are not using file entities as
parameters (and specifying the hash values explicitly or via a
Dataframe or iterable), you can ignore this.
To show the TI lookup functions available for an entity, run the ti contain function.
IpAddress.ti()
lookup_ip function
This is showing an example of a simple query of a domain using a Dns entity
dns = Dns(DomainName="fkksjobnn43.org")

Dns.ti.lookup_dns(dns)
Ioc |
IocType |
SafeIoc |
QuerySubtype |
Provider |
Result |
Severity |
Reference |
Status |
|---|---|---|---|---|---|---|---|---|
fkksjobnn43.org |
dns |
fkksjobnn43.org |
OTX |
True |
high |
https://otx.alienvault.com/api/v1/indicators/domain/fkksjobnn43.org/general |
0 |
|
fkksjobnn43.org |
dns |
OPR |
True |
warning |
https://openpagerank.com/api/v1.0/getPageRank?domains[0]=fkksjobnn43.org |
0 |
||
fkksjobnn43.org |
dns |
fkksjobnn43.org |
VirusTotal |
True |
information |
0 |
||
fkksjobnn43.org |
dns |
fkksjobnn43.org |
XForce |
True |
information |
0 |
Using a simple string value returns the same result (as expected).
Dns.ti.lookup_dns(value="fkksjobnn43.org")
Like other pivot functions, you can provide input from a list.
hashes = [
    "02a7977d1faf7bfc93a4b678a049c9495ea663e7065aa5a6caf0f69c5ff25dbd",
    "06b020a3fd3296bc4c7bf53307fe7b40638e7f445bdd43fac1d04547a429fdaf",
    "06c676bf8f5c6af99172c1cf63a84348628ae3f39df9e523c42447e2045e00ff",
]

File.ti.lookup_file_hash(hashes, providers=["VT"])
Ioc |
IocType |
SafeIoc |
QuerySubtype |
Provider |
Result |
Severity |
Reference |
Status |
|---|---|---|---|---|---|---|---|---|
02a7977d1faf7bfc93a4b678a049c9495ea663e7065aa5a6caf0f69c5ff25dbd |
sha256_hash |
02a7977d1faf7bfc93a4b678a049c9495ea663e7065aa5a6caf0f69c5ff25dbd |
VirusTotal |
True |
high |
0 |
||
06b020a3fd3296bc4c7bf53307fe7b40638e7f445bdd43fac1d04547a429fdaf |
sha256_hash |
06b020a3fd3296bc4c7bf53307fe7b40638e7f445bdd43fac1d04547a429fdaf |
VirusTotal |
True |
high |
0 |
||
06c676bf8f5c6af99172c1cf63a84348628ae3f39df9e523c42447e2045e00ff |
sha256_hash |
06c676bf8f5c6af99172c1cf63a84348628ae3f39df9e523c42447e2045e00ff |
VirusTotal |
True |
high |
0 |
You can use a DataFrame as your input. To specify the source column you can use either “column” or “obs_column”.
# Create a DataFrame from our hash list and add some extra columns
hashes_df = pd.DataFrame(
    [(fh, f"item_{idx}", "stuff") for idx, fh in enumerate(hashes)],
    columns=["hash", "ref", "desc"],
)
display(hashes_df)
File.ti.lookup_file_hash(data=hashes_df, column="hash", providers=["VT"])
Pandas processing pipeline with pivot functions
In an earlier section What is “Pivoting”?, we gave an example of a typical pivoting pipeline that you might see in a CyberSec investigation.
Because pivot functions can take pandas DataFrames as inputs and return them as outputs, you can could imagine implementing this chain of operations as a series of calls to various pivot functions, taking the output from one and feeding it to the next, and so on. Pandas already supports stacking these kinds of operations in what is known as a fluent interface.
Here is an example that chains three operations but without using any intermediate variables to store the results of each step. Each operation is a method of a DataFrame that takes some parameters and its output is another DataFrame - the results of whatever transformation that particular operation performed on the data.
(
    my_df
    .query("UserCount > 1")
    .groupby("User")
    .count()
    .reset_index()
    .drop_duplicates()
    .plot()
)
This is syntactically identical but far more readable than this:
my_df.query("UserCount > 1").groupby("User").count() \
    .reset_index().drop_duplicates().plot()
Note
The use of parentheses around the whole expression in this example let you split operations over multiple lines without having to use ugly line terminator escapes (”"). I find it makes things more readable to keep each operation on its own line, starting each line with the dot separator. When debugging, it also makes it easier to comment out individual pipeline operations.
The advantages of the fluent style are conciseness and not having to deal with intermediate results variables. After building and debugging the pipeline, you’re never going to be interested in these intermediate variables, so why have them hanging around consuming valuable kernel memory?
To make building these types of pipelines easier with pivot functions we’ve implemented a set of pandas helper functions.
These are available in the
mp_pivot
property of pandas DataFrames, and are automatically imported during
MSTICPy initialization.
mp_pivot.run
mp.pivot.run
lets you run a pivot function as a pandas pipeline operation.
Let’s take an example of a simple pivot function using a DataFrame as input
IpAddress.util.whois(data=my_df, column="Ioc")
This takes a DataFrame as the first parameter and returns a DataFrame result. However, suppose we want to use this function using a fluent style in the middle of a larger pandas expression. Let’s say we have an existing pandas expression like this:
(
    my_df
    .query("UserCount > 1")
    .drop_duplicates()
)
We want to add a call to the pivot whois function into the middle of this
without having to create intermediate DataFrames a clutter our code.
We can us mp_pivot.run to do this:
(
    my_df
    .query("UserCount > 1")
    .mp_pivot.run(IpAddress.util.whois, column="Ioc")
    .drop_duplicates()
)
The mp_pivot pandas extension takes care of the data=my_df parameter,
so you do not need to include that.
Although we still need
to add any other required parameters (like the column in this case).
When mp_pivot.run runs, it returns its output as a DataFrame and
passed it as input to the next operation in the pipeline
(drop_duplicates()).
Depending on the scenario, you might want to preserve the DataFrame
content from the preceding stage in the pipeline and carry it over to
the next. Most of the pivot functions only return the results of their specific
operation - e.g. whois returns ASN information for an IP address.
You
can carry the columns of the input DataFrame over to the output from
the pivot function by adding a join parameter to the mp_pivot.run() call.
Use a “left” join to keep all of the input rows regardless of whether the pivot
function returned a result for that row.
Use an “inner” join to return only rows where the input had a positive result
in the pivot function.
...
.df_operation_x()
.mp_pivot.run(IpAddress.util.whois, column="Ioc", join="inner")
.df_operation_y()
mp_pivot.run() also supports a couple of parameters to help with
debugging (or simply to have something interesting to watch while
your pipeline executes).
verbosewill print out the number of rows returned from themp_pivot.runfunction. This is useful to spot cases where the pivot function is returning zero or an unexpected number of results.debugadd a few more details such as the list of columns returned in the data and the execution time of the run function.
There are also a few convenience functions in the mp_pivot pandas accessor.
mp_pivot.display
mp_pivot.display
will display the intermediate results of the DataFrame in the middle
of a pipeline. It does not change the data at all, but does give you the
chance to display a view of the data partway through processing.
This function is also useful for debugging a pipeline.
display supports some parameters that you can use to modify the displayed
output:
title- displays a title above the datacolumns- a list of columns to display (others are hidden)query- you can filter the output using a df.query() string. See DataFrame.query for more detailshead- limits the display to the firstheadrows
These options do not affect the data being passed through the pipeline - only how the intermediate output is displayed.
Note
This function will only work in an IPython/Jupyter environment.
mp_pivot.tee
mp_pivot.tee
behaves a little like the Linux “tee” command that splits an input stream
into two.
mp_pivot.tee allows the input
data to pass through unchanged but allows you to create a variable that
is a snapshot of the data at that point in the pipeline. It takes
a parameter var_name and assigns the current DataFrame instance
to that name. So, when your pipeline has run you can access partial results (again,
without having to break up your pipeline to do so).
By default, it will not overwrite an existing variable of the same name
unless you specify clobber=True in the call to tee.
(
    my_df
    .query("UserCount > 1")
    .mp_pivot.tee("int_musers_df")
    .mp_pivot.run(IpAddress.util.whois, column="Ioc")
    .drop_duplicates()
)

type(int_musers_df)
pandas.core.frame.DataFrame
Note
This function will only work in an IPython/Jupyter environment.
mp_pivot.tee_exec
mp_pivot.tee_exec
behaves similarly to the “tee” function above except that it
will try to execute a named DataFrame operation without
affecting the data in the pipeline. For example, you could use
this to create a plot for intermediate results.
The name of the function to be run should be passed (as a string) in the
df_func named parameter, or the first positional parameter.
The function must be a method of a pandas DataFrame - this includes
built-in functions such as .plot, .sort_values or a custom function
added as a custom pd accessor function (see
Extending pandas)
You can pass other named arguments to the tee_exec. These
will be passed to the df_func function.
(
    my_df
    .query("UserCount > 1")
    .mp_pivot.tee_exec("plot", x="LoginCount")
    .mp_pivot.run(IpAddress.util.whois, column="Ioc")
    .drop_duplicates()
)
mp_pivot.tee_exec passes the DataFrame intermediate results
(at this point in the pipeline) to the tee_exec named function.
However, it does not change the input data that it passes to
the next pipeline operation.
a snapshot of the data at that point in the pipeline to the named function.
The next three methods are simple helper functions that duplicate a subset of the pandas functionality. The syntax is probably more user-friendly than the pandas equivalents but not as powerful and, in some cases, potentially less performant.
mp_pivot.filter
mp_pivot.filter
is a simple text or regular expression filter that matches and returns
only rows with the specified patterns. If you know the exact columns that
you need to filter on, and particularly if the dataset is large, you should
use pandas native query functions like query or boolean filtering.
However, the filter accessor can be useful for quick and dirty uses.
The expr parameter can be a string, a regular expression or a number. In
the former two cases the expression is matched against all string (or pandas object)
columns. The matching is not case-sensitive by default but you can force this
by specifying match_case=True.
If expr is a number, it is matched against numeric columns. However, it is matched
as a string. The value of the expr parameter is converted to a string and all
of the DataFrame columns of type “number” are converted to strings. This lets
you do partial matches on numerics. For example, expr=462 will
match 4624 and 4625 from the numeric EventID columns in Windows Security event
data.
You can also specify a regular expression string to match numeric columns by
adding the numeric_col=True parameter. Using expr="462[4-7]", numeric_col=True
will match numbers in the range 4624-4627.
mp_pivot.filter_cols
mp_pivot.filter_cols
lets you filter the columns in the pipeline.
The cols parameter can be a string (single column) or a list of strings (multiple
columns). Each item can also be a regular expression to let you match groups of
related column names (e.g. “Target.*”).
The match_case parameter (False by default) forces case-sensitive matching on
exact or regular expression matching of column names.
The sort_columns parameter will sort the columns alphabetically in the
output DataFrame - the default is to preserve the input column order.
mp_pivot.sort
mp_pivot.sort
lets you sort the output DataFrame by one or more columns.
The cols parameter specifies which columns to sort by. This can be a single
column name, a string containing a comma-separated list of column names, a
Python list of column names or a Python dictionary of column_name-boolean pairs.
Column names are matched in the following sequence:
exact matches
case-insensitive matches
regular expressions
Where a column regular expression matches more than one column, all matched columns will be added to the column sorting order.
In the case of the string and list types you can add a “:desc” or “:asc” suffix to the name (no spaces) to indicated descending or ascending sort order. Ascending is the default so you typically do not need to add the “:asc” suffix except for reasons of clarity.
You can also control the sorting behavior of individual columns by passing
a dict as the cols parameter. The keys of the dict are the column names
and the value is a boolean: True means ascending, False means descending.
Column sorting priority is controlled by the order in which you specify
the column names/expressions in the cols parameter. E.g.
cols="colA:desc, colB:asc" will sort by colA descending, then by colB, ascending.
You can also force a single ordering for all columns with the ascending
parameter - this will override any column-specific settings.
Example pipeline
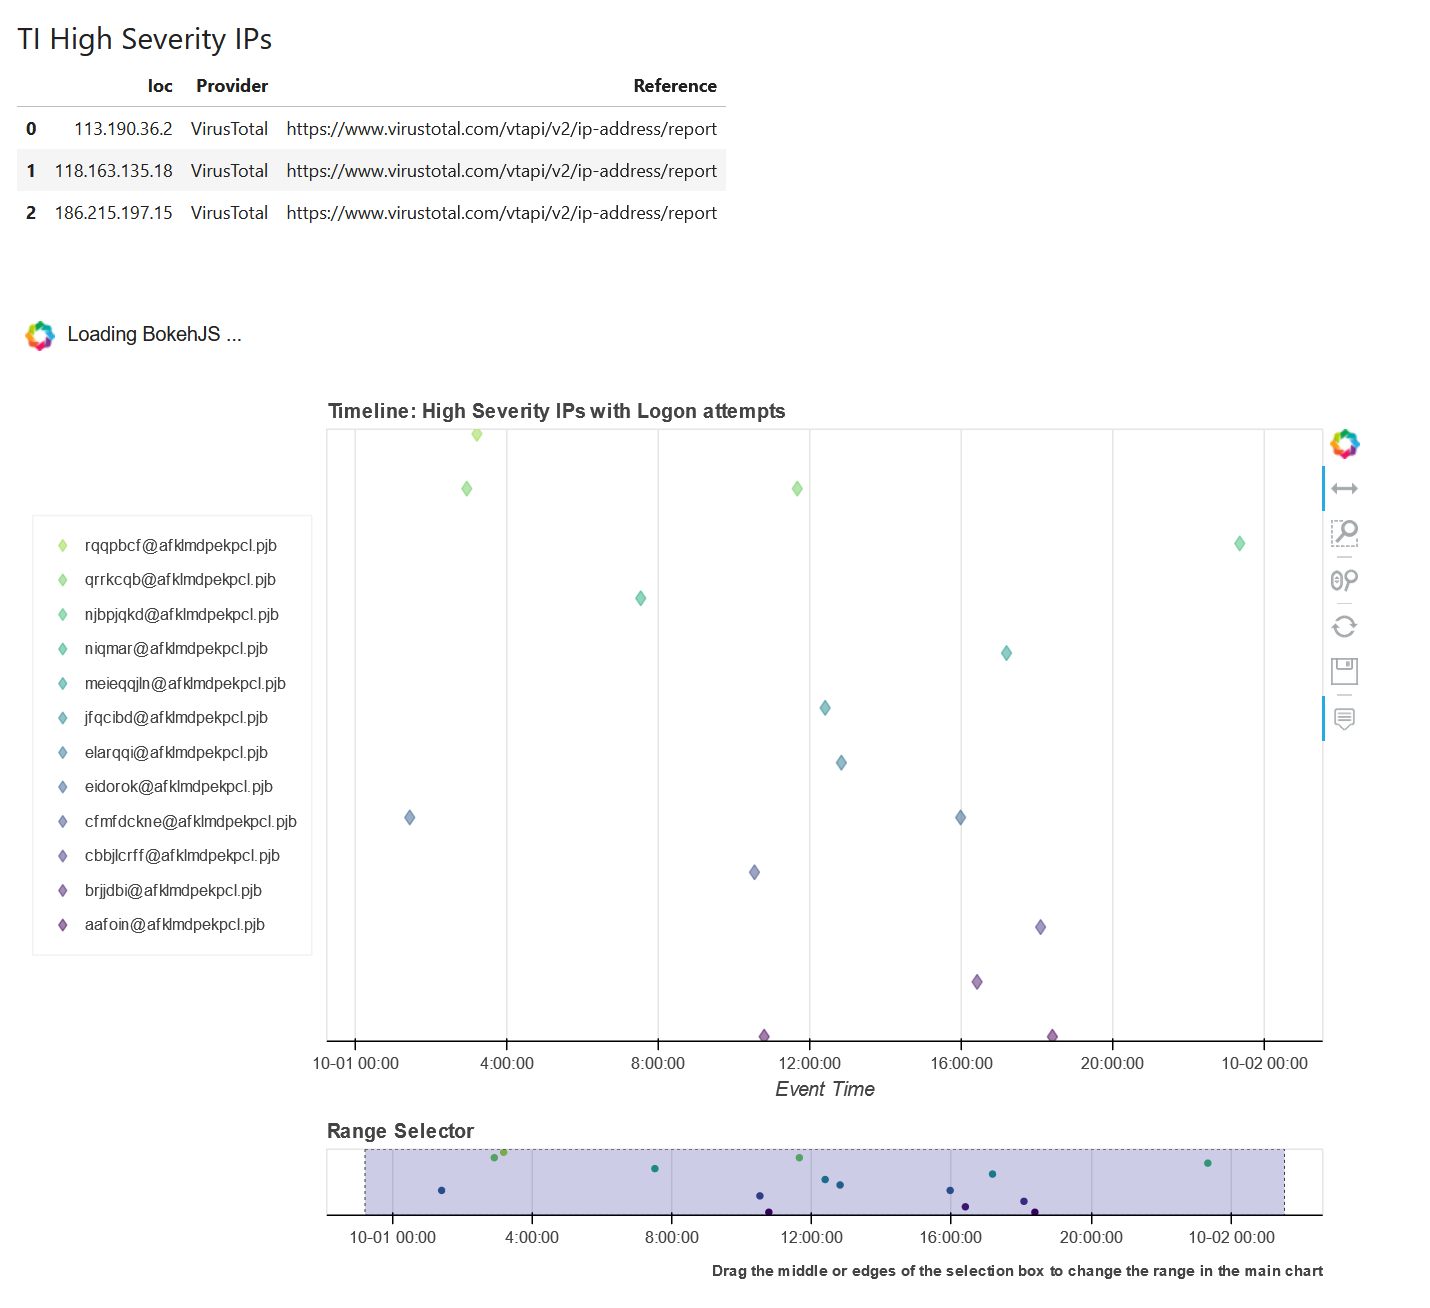
The example below shows the use of mp_pivot.run and mp_pivot.display.
This takes an existing DataFrame - suspicious_ips - and:
checks for threat intelligence reports on any of the IP addresses
uses pandas
queryfunction to filter only the high severity hitscalls the whois pivot function to obtain ownership information for these IPs (note that we join the results of the previous step here using
join='left'so our output will be all TI result data plus whois data)displays a sample of the combined output
uses
teeto save a snapshot to a DF variable ti_whois_dfcalls a pivot data query (AzureSentinel.list_aad_signins_for_ip) to check for Azure Active Directory logins that have an IP address source that matches any of these addresses.
The final step uses another MSTICPy pandas extension to plot the login attempts on a timeline chart.
(
    suspicious_ips
    # Lookup IPs at VT
    .mp_pivot.run(IpAddress.ti.lookup_ipv4_VirusTotal, column="IPAddress")
    # Filter on high severity
    .query("Severity == 'high'")
    # lookup whois info for IPs
    .mp_pivot.run(IpAddress.util.whois, column="Ioc", join="left")
    # display sample of intermediate results
    .mp_pivot.display(title="TI High Severity IPs", cols=["Ioc", "Provider", "Reference"], head=5)
    .mp_pivot.tee(var_name="ti_whois_df")
    # Query IPs that have login attempts
    .mp_pivot.run(IpAddress.AzureSentinel.list_aad_signins_for_ip, ip_address_list="Ioc")
    # Send the output of this to a plot
    .mp_plot.timeline(
        title="High Severity IPs with Logon attempts",
        source_columns=["UserPrincipalName", "IPAddress", "ResultType", "ClientAppUsed", "UserAgent", "Location"],
        group_by="UserPrincipalName"
    )
)
An sample of the results you would see from this pipeline.
Creating custom pipelines as YAML files
You can define a pipeline as a YAML file, then import and execute it using your chosen input DataFrame.
The format of the pipeline YAML file is shown below, illustrating the definitions for the different pipeline types described earlier.
pipelines:
  pipeline1:
    description: Pipeline 1 description
    steps:
      - name: get_logons
        step_type: pivot
        function: util.whois
        entity: IpAddress
        comment: Standard pivot function
        params:
          column: IpAddress
          join: inner
      - name: disp_logons
        step_type: pivot_display
        comment: Pivot display
        params:
          title: "The title"
          cols:
            - Computer
            - Account
          query: Computer.str.startswith('MSTICAlerts')
          head: 10
      - name: tee_logons
        step_type: pivot_tee
        comment: Pivot tee
        params:
            var_name: var_df
            clobber: True
      - name: tee_logons_disp
        step_type: pivot_tee_exec
        comment: Pivot tee_exec with mp_plot.timeline
        function: mp_plot.timeline
        params:
          source_columns:
            - Computer
            - Account
      - name: logons_timeline
        step_type: pd_accessor
        comment: Standard accessor with mp_plot.timeline
        function: mp_plot.timeline
        pos_params:
          - one
          - 2
        params:
          source_columns:
            - Computer
            - Account
  pipeline2:
    description: Pipeline 2
    steps:
      - ...
You can store multiple pipelines in a file. Each pipeline has one or more steps. The pipeline will be run in the order of the steps in the file.
nameis the step namestep_typeis one of:pivot
display
tee
tee_exec
pd_accessor
comment- optional comment to describe the stepfunction- see discussion belowpos_params- a list of positional parametersparams- a dictionary of keyword parameters and values
The function parameter
This is the full name of the function to be executed. This is only needed for step types pivot, tee_exec and pd_accessor.
In the pivot case it must be the full path to the pivot function from the entity (e.g. if you want to call IpAddress.util.whois, enter “util.whois” as the function name).
In the case of tee_exec and pd_accessor this must be the name
or path of the function as if it was being executed as a method of the
DataFrame. For built-in DataFrame methods, such as sort_values or
query, this is simply the function name. For custom accessor
functions this must be the full dotted path. For example, MSTICPy
has a custom accessor mp_plot.timeline() that plots the event
timeline of events in a DataFrame. To invoke this use the full
path of the function - “mp_plot.timeline”.
Reading a saved pipeline
Assuming that you’ve saved the pipeline in a file “pipelines.yml”
from msticpy.init.pivot_core.pivot_pipeline import Pipeline

with open("pipelines.yml", "r") as pl_fh:
    pl_txt = pl_fh.read()
pipelines = list(Pipeline.from_yaml(pl_txt))
print(pipelines[0].print_pipeline())
# Pipeline 1 description
(
    input_df
    # Standard pivot function
    .mp_pivot.run(IpAddress.util.whois, column='IpAddress', join='inner')
    # Pivot display
    .mp_pivot.display(title='The title', query='Computer.str.startswith('MSTICAlerts')', cols=['Computer', 'Account'], head=10)
    # Pivot tee
    .mp_pivot.tee(var_name='var_df', clobber=True)
    # Pivot tee_exec with mp_plot.timeline
    .mp_pivot.tee_exec('mp_plot.timeline', source_columns=['Computer', 'Account'])
    # Standard accessor with mp_plot.timeline
    .mp_plot.timeline('one', 2, source_columns=['Computer', 'Account'])
)
Calling the
print_pipeline
method prints out a representation of
the pipeline as it would appear in code.
See also from_yaml
Running a pipeline
To execute the pipeline call
run on the
pipeline object.
You must supply a parameter data specifying the input DataFrame.
Optionally, you can add verbose=True which will cause a progress bar
and step details to be displayed as the pipeline is executed.