Folium Map Plotting
The FoliumMap
class is a light wrapper around the Folium geo-mapping interactive
mapping package.
See Folium.
Folium is itself built on the leaflet.js library.
The msticpy FoliumMap class expects
IpAddress
entities as input.
Each entity must have a valid Location property populated with
a GeoLocation
object containing the Latitude, Longitude and, optionally, other
attributes.
The GeoIP Lookup module classes return IpAddress entities populated
with this data so can be used seemlessly with the FoliumMap class.
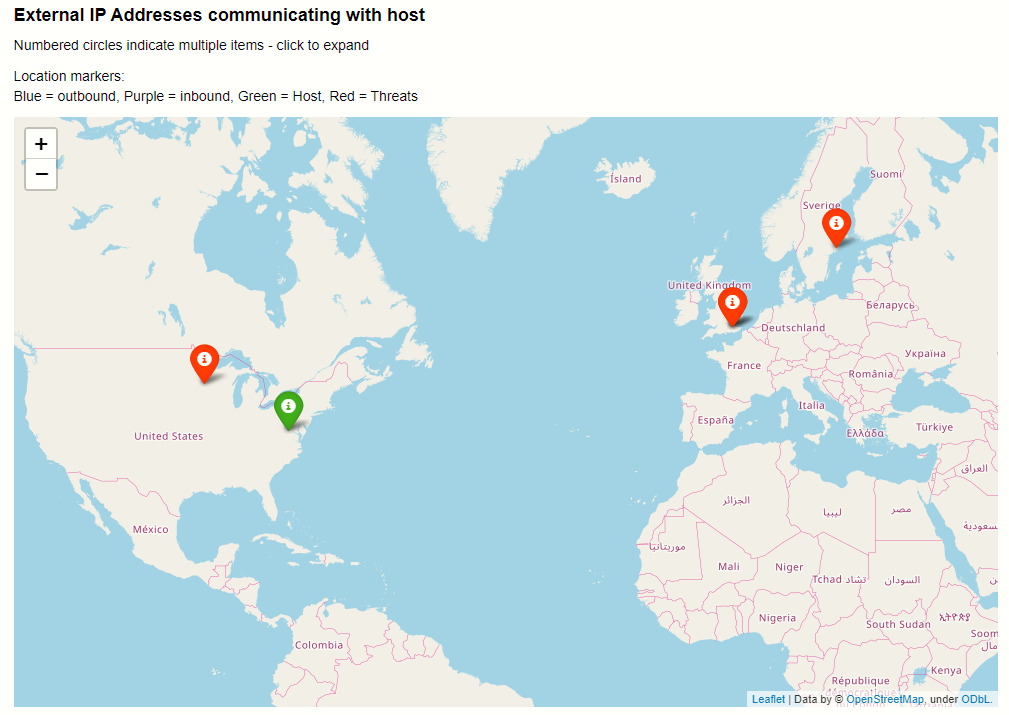
Display a GeoIP Map
Assuming that you have a set of IpAddress objects with location data populated, you can plot the addresses as follows:
from msticpy.nbtools.foliummap import FoliumMap
folium_map = FoliumMap()

# Set Icon properties to display
icon_props = {"color": "green"}

# Set additional properties to display in tooltips
# in AdditionalData property of IpAddress entities
for ips in host_entity.public_ips:
    ips.AdditionalData["host"] = host_entity.HostName
# Add the IP set to the map
folium_map.add_ip_cluster(ip_entities=host_entity.public_ips, **icon_props)

# display the map (or just have folium_map as the last statement
# of the cell - Jupyter will use display() automatically)
display(folium_map)
Converting IP Address Strings to IpAddress entities
This example uses an function to create
IpAddress entities
from IP string or ipaddress objects stored in a pandas DataFrame.
The format_ip_entity function converts the IP string value to
an IpAddress object, looks up the geolocation (this data is populated
into the IpAddress Location attribute). It also adds additional
information from the pandas DataFrame into the AdditionalData attribute.
Values populated here will be displayed in the tooltip for each plotted
IP Address on the map.
Note
The values populated into the AdditionalData attribute are specific to this example. AdditionalData is a dictionary object so you can put data keyed with a string name here. Primitive value types such as string, numbers, dates, etc. should display correctly.
# Create a IP Geolookup class
iplocation = GeoLiteLookup()

def format_ip_entity(row, ip_col):
    ip_entity = entities.IpAddress(Address=row[ip_col])
    iplocation.lookup_ip(ip_entity=ip_entity)
    ip_entity.AdditionalData["protocol"] = row.L7Protocol
    if "severity" in row:
        ip_entity.AdditionalData["threat severity"] = row["severity"]
    if "Details" in row:
        ip_entity.AdditionalData["threat details"] = row["Details"]
    return ip_entity

ips_out = list(selected_out.apply(lambda x: format_ip_entity(x, "dest"), axis=1))
ips_in = list(selected_in.apply(lambda x: format_ip_entity(x, "source"), axis=1))
ips_threats = list(ti_ip_results.apply(lambda x: format_ip_entity(x, "Ioc"), axis=1))

icon_props = {"color": "green"}
for ips in host_entity.public_ips:
    ips.AdditionalData["host"] = host_entity.HostName
folium_map.add_ip_cluster(ip_entities=host_entity.public_ips, **icon_props)
icon_props = {"color": "blue"}
folium_map.add_ip_cluster(ip_entities=ips_out, **icon_props)
icon_props = {"color": "purple"}
folium_map.add_ip_cluster(ip_entities=ips_in, **icon_props)
icon_props = {"color": "red"}
folium_map.add_ip_cluster(ip_entities=ips_threats, **icon_props)

display(folium_map)